


| Duration | 0:00 | Takeoff Distance | 0 |
| Height: | metres |
| Climb: | m/sec |
| Speed: | km/h |
| Distance: | km |
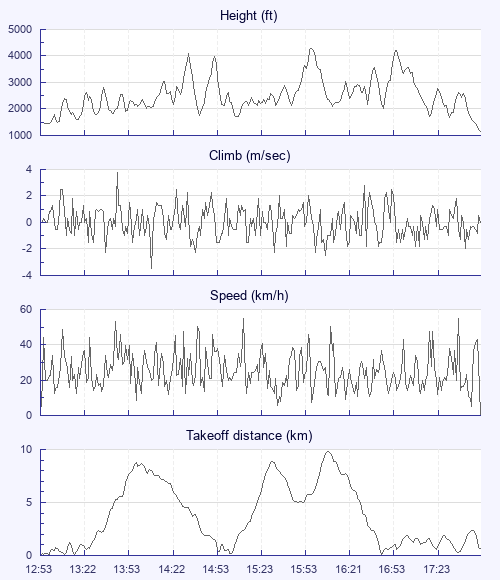
| Height - GPS data | |
| Maximum Height [16:03:57] |
4298 ft |
| Lowest Save [13:05:48] |
1476 ft |
| Takeoff Height [12:53:38] |
1493 ft |
| Landing Height [18:03:21] |
1161 ft |
| Total Ascent | 31096 ft |
| Height Gain | |
| Above Takeoff | 2805 ft |
| Maximum | 2874 ft |
| Low Point [12:57:37] |
1424 ft |
| High Point as Maximum Height |
4298 ft |
| Units | |
| Climb - Pressure data | |
| Maximum Climb [13:46:54] |
3.8 m/s |
| Minimum Climb [14:09:54] |
-3.5 m/s |
| Units | |
| Speed | |
| Maximum Speed [15:16:15] |
54.9 km/h |
| Average Speed around course |
8.9 km/h |
| Average Speed over track length |
25.3 km/h |
| Units | |
| Tracklog | |
| Flight Duration | 5hrs 9mins |
| Track Points | 18517 |
| Recording Interval | 1 secs |
| Statistics Interval | 4 secs |
| Track Length | 130.4 km |
| Units | |
| Flight instrument | |
| Type | Xc_tracer |
| Model | Not Set |
| Firmware | Xc_tracer_v1.0_r05 |
| Height: | |
| Speed: | |
| Climb: | |
| Distance: |
| Main Map: |
| First Tab: |