Xc Title
User:Guest
Naviter advert
Matt Canning  All flights
National League 2018
Flight type image
Turnpoint Flight on a Paraglider
Club
Derbyshire
Glider
Date
19th May 2018
Start
13:48
Finish
16:24
Duration
2hrs 36mins
Takeoff
Fair Snape Fell
Landing
Nr Bainbridge
Coords
Takeoff
53.91670, -2.62978
Start
53.91292, -2.62377
TP1
54.14250, -2.44302
TP2
54.12343, -2.36167
TP3
54.30748, -2.18067
Finish
54.32333, -2.10240
Landing
54.32112, -2.10415
Distances and Score
Leg 1
28.17k
Leg 2
5.73k
Leg 3
23.65k
Leg 4
5.39k
Total
62.94k
Score
62.9
Open Distance
Total
57.0k
Filename
Use full pilot name
Download
Validated
Yes
Flight map
Notes

This map gives an overview of the flight, using the turnpoints to plot the track.

Use the for a detailed map and flight track.

Duration 0:00   Takeoff Distance 0
Controls
To animate the flight: click a point on the track, use the slider, or click the Play button.
slider
slider
Speed
Speed
Slower
Faster
Track color
No data
Highlights
Track data
Time: No data
Height:
Climb:
Speed:
Interval:
Units
Height: metres
Climb: m/sec
Speed: km/h
Distance: km
chart
Notes

Climb and Speed averaged over 4 second intervals.

These values may be lower than those shown by a flight instrument, which has access to continuous raw data.

Metric units are used for all chart data, except for Height which is shown in feet.

Height   -   GPS data
Maximum Height
[14:12:24]
5374 ft
Lowest Save
[15:00:57]
1473 ft
Takeoff Height
[13:44:53]
1467 ft
Landing Height
[16:25:53]
978 ft
Total Ascent 18809 ft
Height Gain
Above Takeoff 3907 ft
Maximum 3967 ft
Low Point
[13:45:36]
1407 ft
High Point
as Maximum Height
5374 ft
Units
Climb   -   Pressure data
Maximum Climb
[15:33:44]
4.5 m/s
Minimum Climb
[13:54:54]
-5.5 m/s
Units
Speed
Maximum Speed
[13:55:14]
70.2 km/h
Average Speed
around course
24.2 km/h
Average Speed
over track length
37.3 km/h
Units
Tracklog
Flight Duration 2hrs 41mins
Track Points 9639
Recording Interval 1 secs
Statistics Interval 4 secs
Track Length 100.2 km
Units
Flight instrument
Type Skybean
Model Skydrop
Firmware Build 3466
Notes

Climb and Speed averaged over 4 second intervals.

These values may be lower than those shown by a flight instrument, which has access to continuous raw data.

Average Speed around course is measured from Start to Finish points.

Track Length is the cumulative distance between track points from Takeoff to Landing.

You can change the default units displayed - see the Options page.

A flight of two halves. The first half was flirting with the sea air because I'd been flying like a numpty early on and not managed to climb out 'til quite late. The sea air made it super hazy, so you could barely see beyond about 5km away and the clouds merged into the haze, so the only way to see where the clouds were was to look for their shadows. The second half was in beautiful clear air flying over the stunning landscape of the Yorkshire Dales.

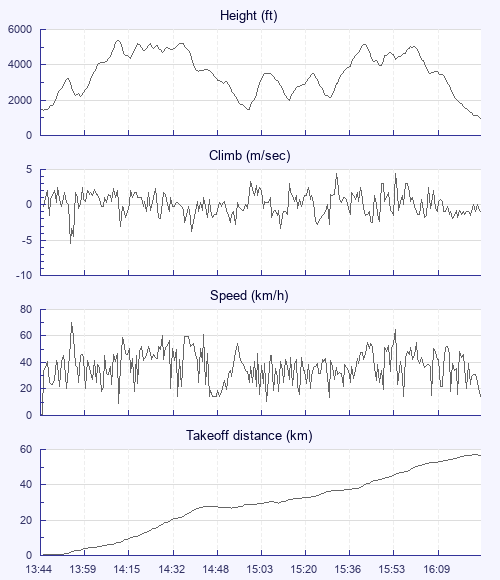
After the inital climb out disappeared just above 3000ft I felt like I was going to bomb out on the moors as I had to fly full speed through some 5m/s sink. Luckily I got another climb, helped out by some seagulls, that took me beyond 5000ft and connected with a great cloud street. I hardly had to turn for the next 15-20km, just stayed above 4500.

After that I think I strayed into the sea air a bit in the gap between the Bowland Fells and the Dales, so while Ingleborough looked like the obvious trigger point, I diverted east to get back towards the clouds. Luckily a rocky south facing escarpment worked as well as it looked like it would and got me back up to 3500ft where there was a nasty inversion which tested my nerves a few times and put a lid on the climbs in the middle section of the flight.

I think I got a bit indecisive and confused at the end of the flight. I was faffing around in the middle of a valley trying to connect with nearby clouds when I should have probably just flown over to the hills on the other side. When I landed though, all the clouds looked a bit ragged and they seemed to dissipate fairly soon after, so at least I wasn't looking up at an epic sky.

Getting back, I managed to hitch a lift on a bus - the driver picked me up in the middle of nowhere and didn't charge me a fare - got the Carlisle to Settle railway which has to be the prettiest train journey in England, then Ed Cleasby gave me a lift back to the hill.

Use this page to set various display Options. You can choose which units are used to display flight data, which map to show when the starts and which tab to show each time you view a flight.
Units settings

Metric units are used by default for the Statistics and XC Player pages, except for Height data which is shown in feet. You can choose your own custom settings here.

Height:
Speed:
Climb:
Distance:
  Use default
XC Player settings

When the XC Player starts, the track data is shown on the Hybrid map. You can choose a different map here.

Main Map:
  Use default
Tab settings

The first tab shown when you view a flight is the Flight Map. You can choose a different tab here.

First Tab:
  Use default
Notes

This page uses cookies to save your settings for future visits.

If you have disabled cookies for this site then any changes you make will not be saved.