


| Duration | 0:00 | Takeoff Distance | 0 |
| Height: | metres |
| Climb: | m/sec |
| Speed: | km/h |
| Distance: | km |
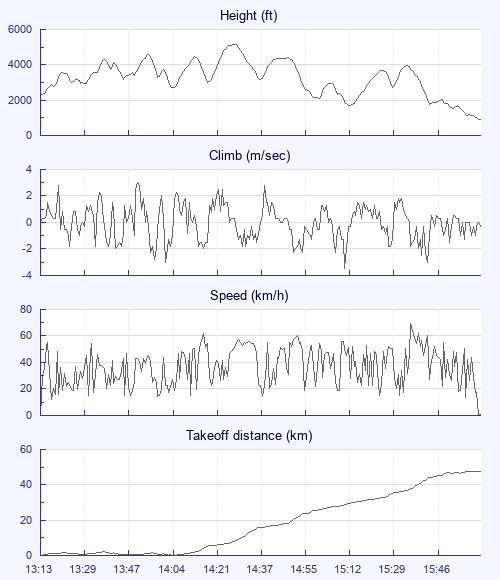
| Height - GPS data | |
| Maximum Height [14:27:52] |
5148 ft |
| Lowest Save [15:12:36] |
1716 ft |
| Takeoff Height [13:13:31] |
2251 ft |
| Landing Height [16:01:36] |
925 ft |
| Total Ascent | 15676 ft |
| Height Gain | |
| Above Takeoff | 2897 ft |
| Maximum | 2904 ft |
| Low Point [13:13:35] |
2244 ft |
| High Point as Maximum Height |
5148 ft |
| Units | |
| Climb - GPS data | |
| Maximum Climb [13:50:24] |
3.0 m/s |
| Minimum Climb [15:11:28] |
-3.5 m/s |
| Units | |
| Speed | |
| Maximum Speed [15:36:24] |
69.3 km/h |
| Average Speed around course |
20.3 km/h |
| Average Speed over track length |
37.2 km/h |
| Units | |
| Tracklog | |
| Flight Duration | 2hrs 48mins |
| Track Points | 2522 |
| Recording Interval | 4 secs |
| Statistics Interval | 4 secs |
| Track Length | 104.1 km |
| Units | |
| Flight instrument - reported as | |
| GPSMap76CSX Software Version 3.50 |
| Height: | |
| Speed: | |
| Climb: | |
| Distance: |
| Main Map: |
| First Tab: |