


| Duration | 0:00 | Takeoff Distance | 0 |
| Height: | metres |
| Climb: | m/sec |
| Speed: | km/h |
| Distance: | km |
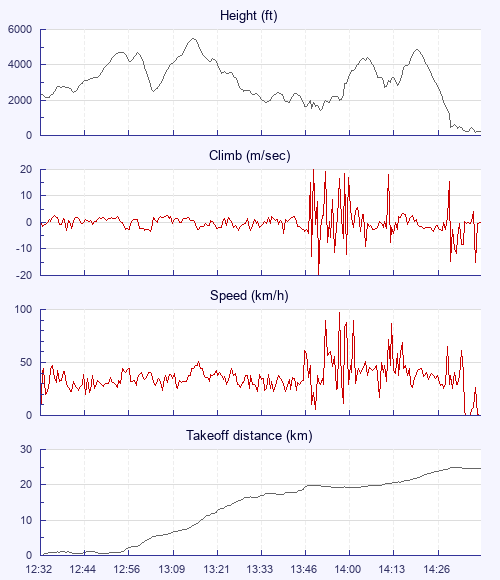
| Height - GPS data | |
| Maximum Height [13:15:16] |
5489 ft |
| Lowest Save [14:36:13] |
243 ft |
| Takeoff Height [12:32:31] |
2388 ft |
| Landing Height [14:39:48] |
207 ft |
| Total Ascent | 31995 ft |
| Height Gain | |
| Above Takeoff | 3100 ft |
| Maximum | 4006 ft |
| Low Point [13:58:33] |
883 ft |
| High Point [14:22:18] |
4888 ft |
| Units | |
| Climb - GPS data | |
| Maximum Climb [13:49:26] |
20.0 m/s |
| Minimum Climb [13:51:26] |
-20.0 m/s |
| Units | |
| Speed | |
| Maximum Speed [13:58:53] |
97.2 km/h |
| Average Speed around course |
17.8 km/h |
| Average Speed over track length |
34.9 km/h |
| Units | |
| Tracklog | |
| Flight Duration | 2hrs 7mins |
| Track Points | 1527 |
| Recording Interval | 5 secs |
| Statistics Interval | 5 secs |
| Track Length | 74.1 km |
| Invalid Positions [2.9%] |
45 |
| Invalid Heights [1.2%] |
19 |
| Units | |
| Flight instrument - reported as | |
| Garmin USB: eTrex LegendCx Software Version 2.50 |
| Height: | |
| Speed: | |
| Climb: | |
| Distance: |
| Main Map: |
| First Tab: |