


| Duration | 0:00 | Takeoff Distance | 0 |
| Height: | metres |
| Climb: | m/sec |
| Speed: | km/h |
| Distance: | km |
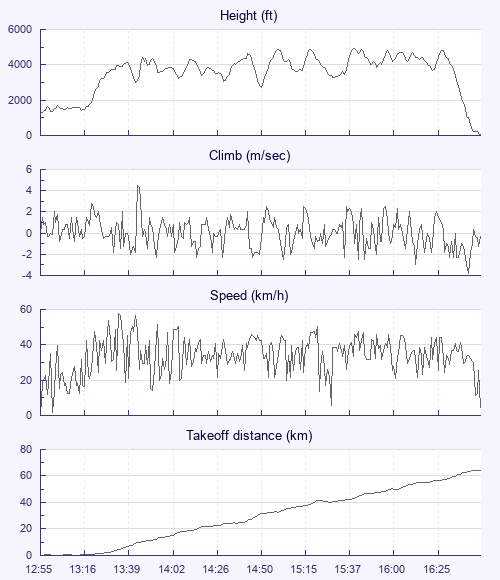
| Height - GPS data | |
| Maximum Height [15:39:16] |
4948 ft |
| Lowest Save [13:00:51] |
1355 ft |
| Takeoff Height [12:55:13] |
1237 ft |
| Landing Height [16:44:11] |
56 ft |
| Total Ascent | 24803 ft |
| Height Gain | |
| Above Takeoff | 3711 ft |
| Maximum | 3720 ft |
| Low Point [12:55:16] |
1227 ft |
| High Point as Maximum Height |
4948 ft |
| Units | |
| Climb - Pressure data | |
| Maximum Climb [13:43:21] |
4.5 m/s |
| Minimum Climb [16:41:09] |
-3.8 m/s |
| Units | |
| Speed | |
| Maximum Speed [13:33:29] |
57.6 km/h |
| Average Speed around course |
19.8 km/h |
| Average Speed over track length |
34.5 km/h |
| Units | |
| Tracklog | |
| Flight Duration | 3hrs 48mins |
| Track Points | 13739 |
| Recording Interval | 1 secs |
| Statistics Interval | 4 secs |
| Track Length | 131.6 km |
| Units | |
| Flight instrument | |
| Type | Oudie 4 |
| Model | Not Set |
| Firmware | 7.32.001 |
| Height: | |
| Speed: | |
| Climb: | |
| Distance: |
| Main Map: |
| First Tab: |