


| Duration | 0:00 | Takeoff Distance | 0 |
| Height: | metres |
| Climb: | m/sec |
| Speed: | km/h |
| Distance: | km |
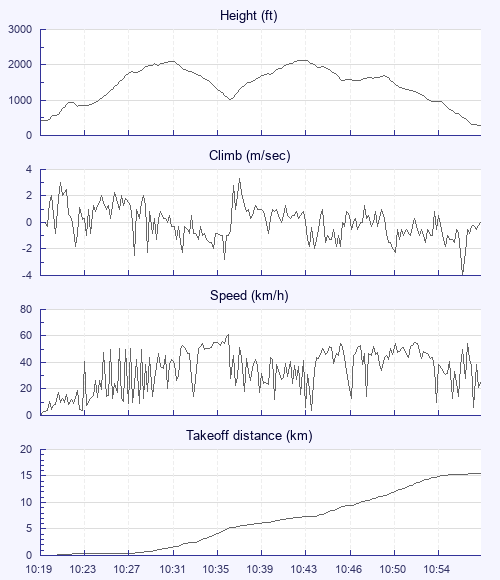
| Height - GPS data | |
| Maximum Height [10:43:06] |
2133 ft |
| Lowest Save [10:36:34] |
1030 ft |
| Takeoff Height [10:19:42] |
433 ft |
| Landing Height [10:58:05] |
285 ft |
| Total Ascent | 3734 ft |
| Height Gain | |
| Above Takeoff | 1699 ft |
| Units | |
| Climb - Pressure data | |
| Maximum Climb [10:37:17] |
3.3 m/s |
| Minimum Climb [10:57:09] |
-4.0 m/s |
| Units | |
| Speed | |
| Maximum Speed [10:36:29] |
61.2 km/h |
| Average Speed around course |
25.8 km/h |
| Average Speed over track length |
34.5 km/h |
| Units | |
| Tracklog | |
| Flight Duration | 38mins |
| Track Points | 2293 |
| Recording Interval | 1 secs |
| Statistics Interval | 4 secs |
| Track Length | 22.1 km |
| Units | |
| Flight instrument | |
| Type | Xc_tracer |
| Model | Not Set |
| Firmware | Xc_tracer_v1.0_r05 |
| Height: | |
| Speed: | |
| Climb: | |
| Distance: |
| Main Map: |
| First Tab: |