


| Duration | 0:00 | Takeoff Distance | 0 |
| Height: | metres |
| Climb: | m/sec |
| Speed: | km/h |
| Distance: | km |
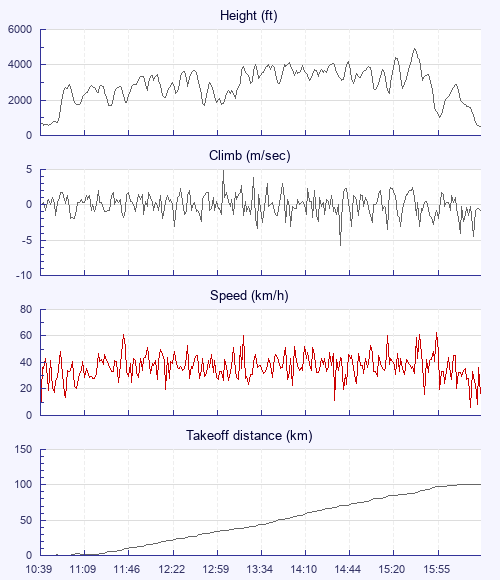
| Height - GPS data | |
| Maximum Height [15:38:36] |
4911 ft |
| Lowest Save [15:56:38] |
1030 ft |
| Takeoff Height [10:39:05] |
669 ft |
| Landing Height [16:23:26] |
489 ft |
| Total Ascent | 39990 ft |
| Height Gain | |
| Above Takeoff | 4242 ft |
| Maximum | 4344 ft |
| Low Point [10:46:02] |
568 ft |
| High Point as Maximum Height |
4911 ft |
| Units | |
| Climb - Pressure data | |
| Maximum Climb [13:04:17] |
4.8 m/s |
| Minimum Climb [14:38:34] |
-5.8 m/s |
| Units | |
| Speed | |
| Maximum Speed [15:55:13] |
63.0 km/h |
| Average Speed around course |
20.4 km/h |
| Average Speed over track length |
37.1 km/h |
| Units | |
| Tracklog | |
| Flight Duration | 5hrs 44mins |
| Track Points | 20662 |
| Recording Interval | 1 secs |
| Statistics Interval | 4 secs |
| Track Length | 213.1 km |
| Invalid Positions [< 1%] |
32 |
| Units | |
| Flight instrument | |
| Type | Syride |
| Model | Sys'Gps |
| Firmware | 1.25 |
| Height: | |
| Speed: | |
| Climb: | |
| Distance: |
| Main Map: |
| First Tab: |