


| Duration | 0:00 | Takeoff Distance | 0 |
| Height: | metres |
| Climb: | m/sec |
| Speed: | km/h |
| Distance: | km |
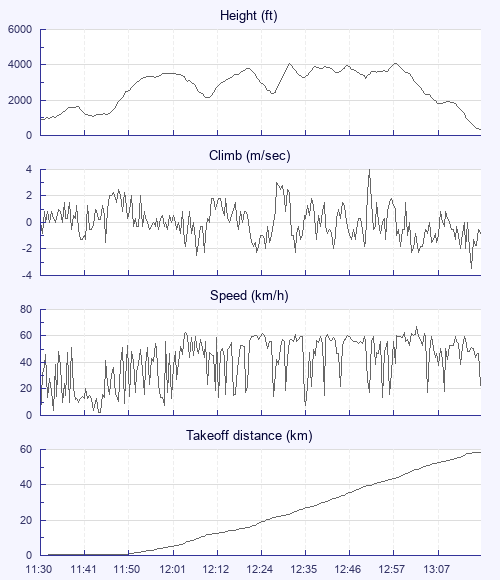
| Height - GPS data | |
| Maximum Height [12:58:29] |
4098 ft |
| Lowest Save [11:43:10] |
1102 ft |
| Takeoff Height [11:30:55] |
843 ft |
| Landing Height [13:18:13] |
341 ft |
| Total Ascent | 11119 ft |
| Height Gain | |
| Above Takeoff | 3255 ft |
| Units | |
| Climb - Pressure data | |
| Maximum Climb [12:52:11] |
4.0 m/s |
| Minimum Climb [13:17:07] |
-3.5 m/s |
| Units | |
| Speed | |
| Maximum Speed [13:03:27] |
67.5 km/h |
| Average Speed around course |
34.3 km/h |
| Average Speed over track length |
42.9 km/h |
| Units | |
| Tracklog | |
| Flight Duration | 1hr 47mins |
| Track Points | 6439 |
| Recording Interval | 1 secs |
| Statistics Interval | 4 secs |
| Track Length | 76.7 km |
| Units | |
| Height: | |
| Speed: | |
| Climb: | |
| Distance: |
| Main Map: |
| First Tab: |