


| Duration | 0:00 | Takeoff Distance | 0 |
| Height: | metres |
| Climb: | m/sec |
| Speed: | km/h |
| Distance: | km |
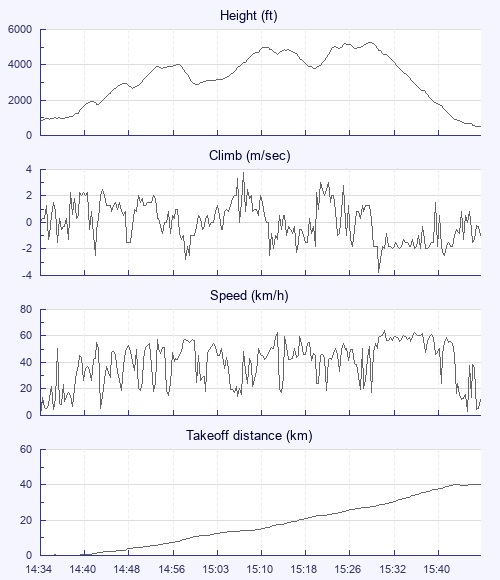
| Height - GPS data | |
| Maximum Height [15:31:02] |
5282 ft |
| Lowest Save [15:00:45] |
2890 ft |
| Takeoff Height [14:34:16] |
840 ft |
| Landing Height [15:47:44] |
509 ft |
| Total Ascent | 9104 ft |
| Height Gain | |
| Above Takeoff | 4442 ft |
| Units | |
| Climb - Pressure data | |
| Maximum Climb [15:08:48] |
3.8 m/s |
| Minimum Climb [15:32:12] |
-3.8 m/s |
| Units | |
| Speed | |
| Maximum Speed [15:32:44] |
63.9 km/h |
| Average Speed around course |
35.0 km/h |
| Average Speed over track length |
41.5 km/h |
| Units | |
| Tracklog | |
| Flight Duration | 1hr 13mins |
| Track Points | 4409 |
| Recording Interval | 1 secs |
| Statistics Interval | 4 secs |
| Track Length | 50.8 km |
| Units | |
| Flight instrument - reported as | |
| Flymaster F1, V1.6, S/N 723 |
| Height: | |
| Speed: | |
| Climb: | |
| Distance: |
| Main Map: |
| First Tab: |