


| Duration | 0:00 | Takeoff Distance | 0 |
| Height: | metres |
| Climb: | m/sec |
| Speed: | km/h |
| Distance: | km |
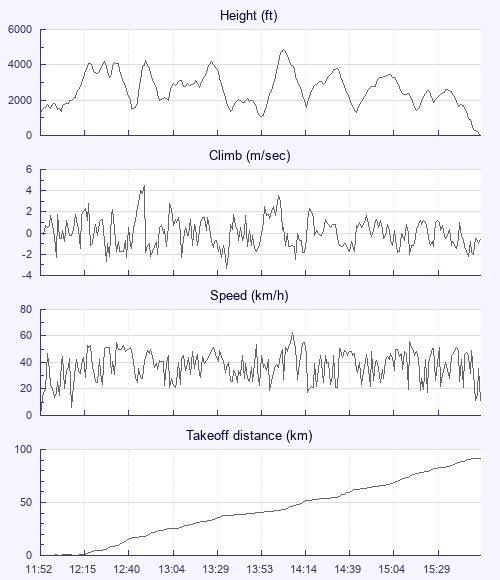
| Height - GPS data | |
| Maximum Height [14:06:47] |
4856 ft |
| Lowest Save [13:55:47] |
1086 ft |
| Takeoff Height [11:52:07] |
1217 ft |
| Landing Height [15:57:29] |
0 ft |
| Total Ascent | 24892 ft |
| Height Gain | |
| Above Takeoff | 3638 ft |
| Maximum | 3770 ft |
| Low Point as Lowest Save |
1086 ft |
| High Point as Maximum Height |
4856 ft |
| Units | |
| Climb - Pressure data | |
| Maximum Climb [12:49:45] |
4.5 m/s |
| Minimum Climb [13:36:41] |
-3.3 m/s |
| Units | |
| Speed | |
| Maximum Speed [14:10:26] |
63.0 km/h |
| Average Speed around course |
23.6 km/h |
| Average Speed over track length |
37.7 km/h |
| Units | |
| Tracklog | |
| Flight Duration | 4hrs 5mins |
| Track Points | 4854 |
| Recording Interval | 3 secs |
| Statistics Interval | 6 secs |
| Track Length | 154.2 km |
| Units | |
| Flight instrument | |
| Type | Flytec |
| Model | 6020 |
| Firmware | 3.10 |
| Height: | |
| Speed: | |
| Climb: | |
| Distance: |
| Main Map: |
| First Tab: |