


| Duration | 0:00 | Takeoff Distance | 0 |
| Height: | metres |
| Climb: | m/sec |
| Speed: | km/h |
| Distance: | km |
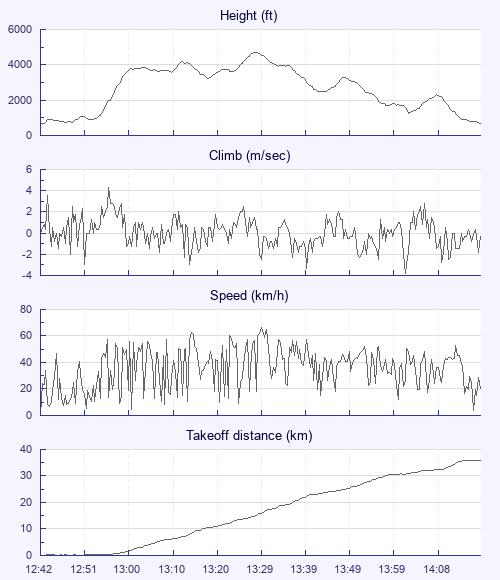
| Height - GPS data | |
| Maximum Height [13:29:05] |
4721 ft |
| Lowest Save [14:02:51] |
1253 ft |
| Takeoff Height [12:42:11] |
640 ft |
| Landing Height [14:17:43] |
673 ft |
| Total Ascent | 10118 ft |
| Height Gain | |
| Above Takeoff | 4081 ft |
| Units | |
| Climb - Pressure data | |
| Maximum Climb [12:55:59] |
4.3 m/s |
| Minimum Climb [14:02:27] |
-3.8 m/s |
| Units | |
| Speed | |
| Maximum Speed [13:30:07] |
66.6 km/h |
| Average Speed around course |
25.9 km/h |
| Average Speed over track length |
36.4 km/h |
| Units | |
| Tracklog | |
| Flight Duration | 1hr 35mins |
| Track Points | 2867 |
| Recording Interval | 2 secs |
| Statistics Interval | 4 secs |
| Track Length | 57.9 km |
| Units | |
| Flight instrument - reported as | |
| Flymaster F1, V1.21, S/N 2419 |
| Height: | |
| Speed: | |
| Climb: | |
| Distance: |
| Main Map: |
| First Tab: |