


| Duration | 0:00 | Takeoff Distance | 0 |
| Height: | metres |
| Climb: | m/sec |
| Speed: | km/h |
| Distance: | km |
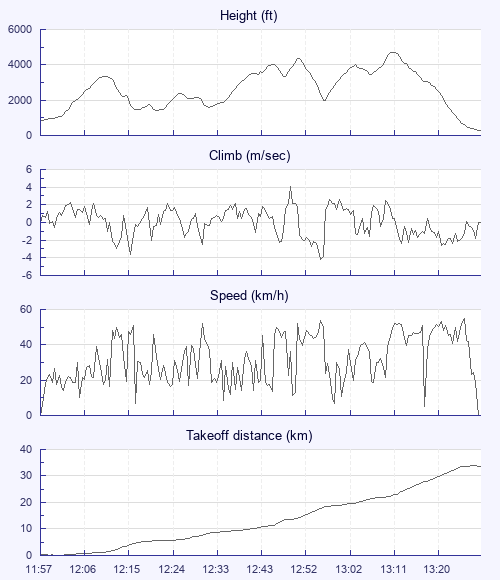
| Height - GPS data | |
| Maximum Height [13:11:56] |
4715 ft |
| Lowest Save [12:21:36] |
1427 ft |
| Takeoff Height [11:57:55] |
781 ft |
| Landing Height [13:29:14] |
272 ft |
| Total Ascent | 11322 ft |
| Height Gain | |
| Above Takeoff | 3934 ft |
| Units | |
| Climb - Pressure data | |
| Maximum Climb [12:49:46] |
4.1 m/s |
| Minimum Climb [12:56:00] |
-4.2 m/s |
| Units | |
| Speed | |
| Maximum Speed [13:26:32] |
55.1 km/h |
| Average Speed around course |
24.4 km/h |
| Average Speed over track length |
32.0 km/h |
| Units | |
| Tracklog | |
| Flight Duration | 1hr 31mins |
| Track Points | 539 |
| Recording Interval | 10 secs |
| Statistics Interval | 10 secs |
| Track Length | 48.7 km |
| Units | |
| Flight instrument | |
| Type | Brauniger |
| Model | Compeo+ |
| Firmware | 3.37 |
| Height: | |
| Speed: | |
| Climb: | |
| Distance: |
| Main Map: |
| First Tab: |