


| Duration | 0:00 | Takeoff Distance | 0 |
| Height: | metres |
| Climb: | m/sec |
| Speed: | km/h |
| Distance: | km |
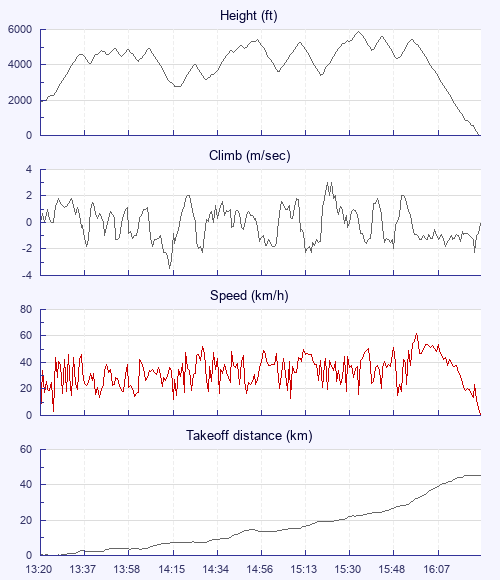
| Height - GPS data | |
| Maximum Height [15:34:54] |
5869 ft |
| Lowest Save [14:16:34] |
2749 ft |
| Takeoff Height [13:20:01] |
1847 ft |
| Landing Height [16:24:23] |
0 ft |
| Total Ascent | 15495 ft |
| Height Gain | |
| Above Takeoff | 4022 ft |
| Maximum | 4026 ft |
| Low Point [13:20:05] |
1844 ft |
| High Point as Maximum Height |
5869 ft |
| Units | |
| Climb - GPS data | |
| Maximum Climb [15:20:32] |
3.0 m/s |
| Minimum Climb [14:15:21] |
-3.5 m/s |
| Units | |
| Speed | |
| Maximum Speed [15:59:51] |
61.7 km/h |
| Average Speed around course |
21.1 km/h |
| Average Speed over track length |
32.9 km/h |
| Units | |
| Tracklog | |
| Flight Duration | 3hrs 4mins |
| Track Points | 3180 |
| Recording Interval | 3 secs |
| Statistics Interval | 6 secs |
| Track Length | 101.2 km |
| Invalid Positions [< 1%] |
1 |
| Units | |
| Flight instrument - reported as | |
| GPSMAP 78s Software Version 4.30 |
| Height: | |
| Speed: | |
| Climb: | |
| Distance: |
| Main Map: |
| First Tab: |