


| Duration | 0:00 | Takeoff Distance | 0 |
| Height: | metres |
| Climb: | m/sec |
| Speed: | km/h |
| Distance: | km |
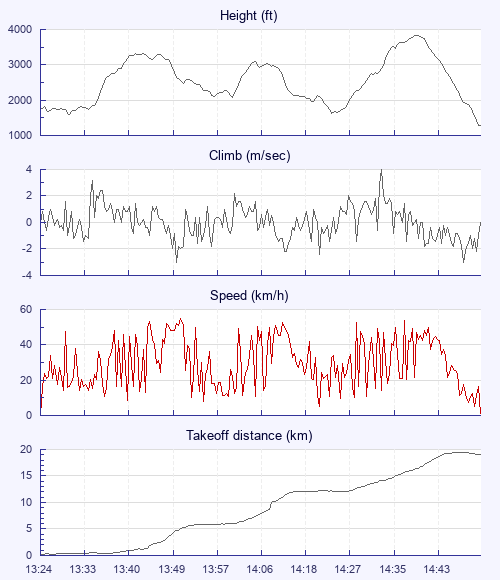
| Height - GPS data | |
| Maximum Height [14:41:07] |
3839 ft |
| Lowest Save [14:24:57] |
1631 ft |
| Takeoff Height [13:24:17] |
1722 ft |
| Landing Height [14:52:22] |
1280 ft |
| Total Ascent | 7293 ft |
| Height Gain | |
| Above Takeoff | 2116 ft |
| Maximum | 2247 ft |
| Low Point [13:30:07] |
1591 ft |
| High Point as Maximum Height |
3839 ft |
| Units | |
| Climb - GPS data | |
| Maximum Climb [14:34:17] |
4.0 m/s |
| Minimum Climb [13:50:52] |
-3.0 m/s |
| Units | |
| Speed | |
| Maximum Speed [13:51:07] |
54.7 km/h |
| Average Speed around course |
18.5 km/h |
| Average Speed over track length |
29.3 km/h |
| Units | |
| Tracklog | |
| Flight Duration | 1hr 28mins |
| Track Points | 1012 |
| Recording Interval | 5 secs |
| Statistics Interval | 5 secs |
| Track Length | 43.0 km |
| Invalid Positions [< 1%] |
2 |
| Units | |
| Flight instrument - reported as | |
| GPSMAP 76S Software Version 4.00 |
| Height: | |
| Speed: | |
| Climb: | |
| Distance: |
| Main Map: |
| First Tab: |