


| Duration | 0:00 | Takeoff Distance | 0 |
| Height: | metres |
| Climb: | m/sec |
| Speed: | km/h |
| Distance: | km |
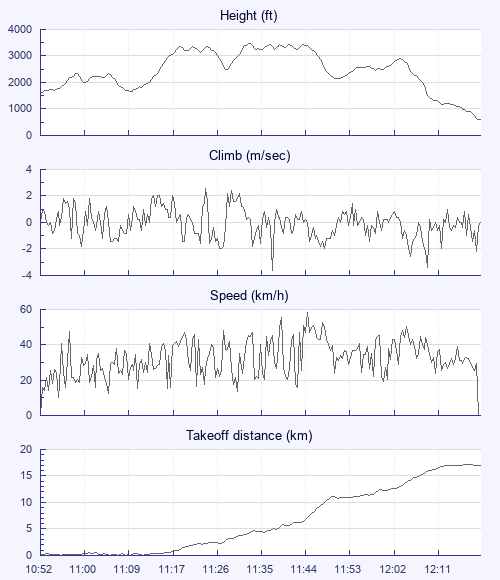
| Height - GPS data | |
| Maximum Height [11:34:37] |
3484 ft |
| Lowest Save [11:10:17] |
1657 ft |
| Takeoff Height [10:52:01] |
1591 ft |
| Landing Height [12:22:24] |
600 ft |
| Total Ascent | 7047 ft |
| Height Gain | |
| Above Takeoff | 1893 ft |
| Maximum | 1900 ft |
| Low Point [10:52:06] |
1585 ft |
| High Point as Maximum Height |
3484 ft |
| Units | |
| Climb - GPS data | |
| Maximum Climb [11:25:27] |
2.6 m/s |
| Minimum Climb [11:38:52] |
-3.6 m/s |
| Units | |
| Speed | |
| Maximum Speed [11:46:12] |
58.3 km/h |
| Average Speed around course |
13.3 km/h |
| Average Speed over track length |
32.1 km/h |
| Units | |
| Tracklog | |
| Flight Duration | 1hr 30mins |
| Track Points | 1085 |
| Recording Interval | 5 secs |
| Statistics Interval | 5 secs |
| Track Length | 48.4 km |
| Units | |
| Flight instrument - reported as | |
| GPSmap 96C Software Version 3.00 |
| Height: | |
| Speed: | |
| Climb: | |
| Distance: |
| Main Map: |
| First Tab: |