


| Duration | 0:00 | Takeoff Distance | 0 |
| Height: | metres |
| Climb: | m/sec |
| Speed: | km/h |
| Distance: | km |
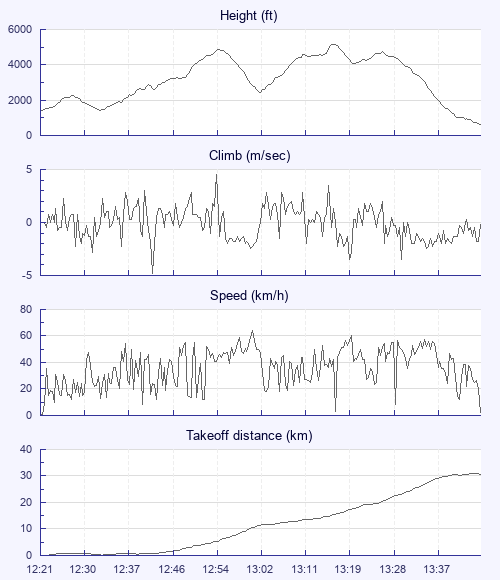
| Height - GPS data | |
| Maximum Height [13:19:01] |
5174 ft |
| Lowest Save [12:32:47] |
1437 ft |
| Takeoff Height [12:21:48] |
1437 ft |
| Landing Height [13:48:15] |
640 ft |
| Total Ascent | 10289 ft |
| Height Gain | |
| Above Takeoff | 3737 ft |
| Units | |
| Climb - Pressure data | |
| Maximum Climb [12:55:36] |
4.5 m/s |
| Minimum Climb [12:43:16] |
-4.8 m/s |
| Units | |
| Speed | |
| Maximum Speed [13:02:52] |
63.9 km/h |
| Average Speed around course |
24.3 km/h |
| Average Speed over track length |
37.0 km/h |
| Units | |
| Tracklog | |
| Flight Duration | 1hr 26mins |
| Track Points | 5188 |
| Recording Interval | 1 secs |
| Statistics Interval | 4 secs |
| Track Length | 53.3 km |
| Units | |
| Flight instrument - reported as | |
| Flymaster F1, V1.5, S/N 1737 |
| Height: | |
| Speed: | |
| Climb: | |
| Distance: |
| Main Map: |
| First Tab: |