


| Duration | 0:00 | Takeoff Distance | 0 |
| Height: | metres |
| Climb: | m/sec |
| Speed: | km/h |
| Distance: | km |
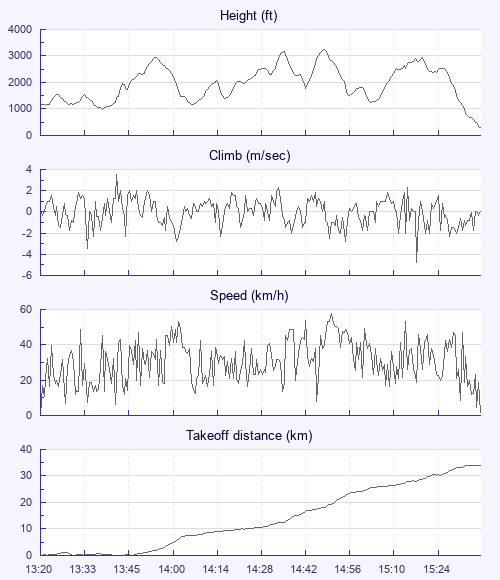
| Height - GPS data | |
| Maximum Height [14:50:01] |
3232 ft |
| Lowest Save [14:06:51] |
1155 ft |
| Takeoff Height [13:20:45] |
1125 ft |
| Landing Height [15:37:43] |
315 ft |
| Total Ascent | 13323 ft |
| Height Gain | |
| Above Takeoff | 2106 ft |
| Maximum | 2241 ft |
| Low Point [13:38:00] |
991 ft |
| High Point as Maximum Height |
3232 ft |
| Units | |
| Climb - Pressure data | |
| Maximum Climb [13:42:49] |
3.5 m/s |
| Minimum Climb [15:19:08] |
-4.8 m/s |
| Units | |
| Speed | |
| Maximum Speed [14:51:29] |
57.6 km/h |
| Average Speed around course |
17.0 km/h |
| Average Speed over track length |
31.6 km/h |
| Units | |
| Tracklog | |
| Flight Duration | 2hrs 16mins |
| Track Points | 8214 |
| Recording Interval | 1 secs |
| Statistics Interval | 4 secs |
| Track Length | 72.2 km |
| Units | |
| Flight instrument - reported as | |
| Flymaster F1, V1.3, S/N 131 |
| Height: | |
| Speed: | |
| Climb: | |
| Distance: |
| Main Map: |
| First Tab: |