


| Duration | 0:00 | Takeoff Distance | 0 |
| Height: | metres |
| Climb: | m/sec |
| Speed: | km/h |
| Distance: | km |
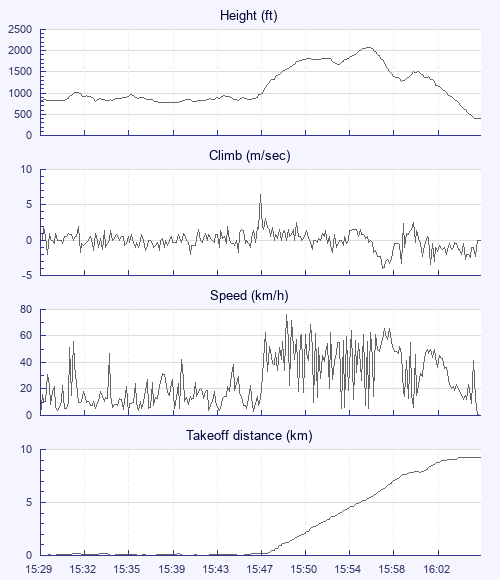
| Height - GPS data | |
| Maximum Height [15:56:54] |
2080 ft |
| Takeoff Height [15:29:01] |
840 ft |
| Landing Height [16:06:29] |
404 ft |
| Total Ascent | 3402 ft |
| Height Gain | |
| Above Takeoff | 1240 ft |
| Maximum | 1319 ft |
| Low Point [15:39:23] |
761 ft |
| High Point as Maximum Height |
2080 ft |
| Units | |
| Climb - Pressure data | |
| Maximum Climb [15:47:39] |
6.5 m/s |
| Minimum Climb [15:58:11] |
-4.0 m/s |
| Units | |
| Speed | |
| Maximum Speed [15:49:49] |
76.5 km/h |
| Average Speed around course |
17.5 km/h |
| Average Speed over track length |
26.7 km/h |
| Units | |
| Tracklog | |
| Flight Duration | 37mins |
| Track Points | 1475 |
| Recording Interval | 2 secs |
| Statistics Interval | 4 secs |
| Track Length | 16.7 km |
| Units | |
| Flight instrument | |
| Type | Flyskyhy |
| Model | 4.0 |
| Firmware | 4.0 |
| Height: | |
| Speed: | |
| Climb: | |
| Distance: |
| Main Map: |
| First Tab: |