Xc Title
User:Guest
Naviter advert
Paul Midgley  All flights
National League 2015
Flight type image
Turnpoint Flight on a Paraglider
Club
SMPC
Glider
Advance Iota
Date
13th May 2015
Start
13:16
Finish
14:22
Duration
1hr 5mins
Takeoff
White Corries
Landing
Nr Ben Toaig
Coords
Takeoff
56.62895, -4.84170
Start
56.62895, -4.84170
TP1
56.63420, -4.85953
TP2
56.62387, -4.81962
TP3
56.55745, -4.88312
Finish
56.54900, -4.84428
Landing
56.54895, -4.84467
Distances and Score
Leg 1
1.24k
Leg 2
2.71k
Leg 3
8.36k
Leg 4
2.57k
Total
14.88k
Score
14.9
Open Distance
Total
9.7k
Filename
Use full pilot name
Download
Validated
Yes
Flight map
Notes

This map gives an overview of the flight, using the turnpoints to plot the track.

Use the for a detailed map and flight track.

Duration 0:00   Takeoff Distance 0
Controls
To animate the flight: click a point on the track, use the slider, or click the Play button.
slider
slider
Speed
Speed
Slower
Faster
Track color
No data
Highlights
Track data
Time: No data
Height:
Climb:
Speed:
Interval:
Units
Height: metres
Climb: m/sec
Speed: km/h
Distance: km
chart
Notes

Climb and Speed averaged over 4 second intervals.

These values may be lower than those shown by a flight instrument, which has access to continuous raw data.

Red values indicate suspect data, because the tracklog contains invalid points.

Metric units are used for all chart data, except for Height which is shown in feet.

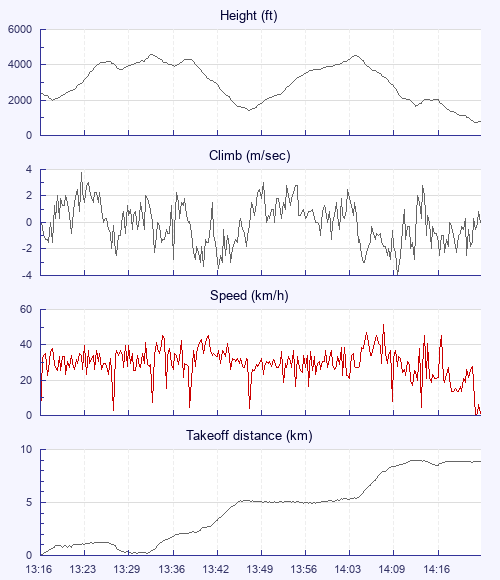
Height   -   Pressure data
Maximum Height
[13:33:21]
4570 ft
Lowest Save
[13:47:43]
1437 ft
Takeoff Height
[13:16:46]
2405 ft
Landing Height
[14:22:41]
771 ft
Total Ascent 8123 ft
Height Gain
Above Takeoff 2165 ft
Maximum 3100 ft
Low Point
as Lowest Save
1437 ft
High Point
[14:04:14]
4537 ft
Units
Climb   -   Pressure data
Maximum Climb
[13:22:58]
3.8 m/s
Minimum Climb
[14:10:23]
-4.0 m/s
Units
Speed
Maximum Speed
[14:08:39]
51.3 km/h
Average Speed
around course
13.6 km/h
Average Speed
over track length
30.4 km/h
Units
Tracklog
Flight Duration 1hr 5mins
Track Points 3956
Recording Interval 1 secs
Statistics Interval 4 secs
Track Length 33.4 km
Invalid Positions
[< 1%]
1
Units
Flight instrument   -   reported as
AIRCOTEC SN:4546 SW:3.2
Notes

Climb and Speed averaged over 4 second intervals.

These values may be lower than those shown by a flight instrument, which has access to continuous raw data.

Red values indicate suspect data, because the tracklog contains invalid points.

Average Speed around course is measured from Start to Finish points.

Track Length is the cumulative distance between track points from Takeoff to Landing.

You can change the default units displayed - see the Options page.

Use this page to set various display Options. You can choose which units are used to display flight data, which map to show when the starts and which tab to show each time you view a flight.
Units settings

Metric units are used by default for the Statistics and XC Player pages, except for Height data which is shown in feet. You can choose your own custom settings here.

Height:
Speed:
Climb:
Distance:
  Use default
XC Player settings

When the XC Player starts, the track data is shown on the Hybrid map. You can choose a different map here.

Main Map:
  Use default
Tab settings

The first tab shown when you view a flight is the Flight Map. You can choose a different tab here.

First Tab:
  Use default
Notes

This page uses cookies to save your settings for future visits.

If you have disabled cookies for this site then any changes you make will not be saved.