


| Duration | 0:00 | Takeoff Distance | 0 |
| Height: | metres |
| Climb: | m/sec |
| Speed: | km/h |
| Distance: | km |
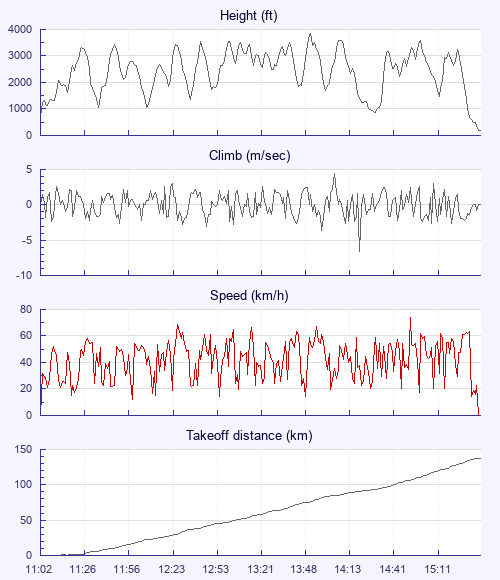
| Height - GPS data | |
| Maximum Height [13:55:13] |
3832 ft |
| Lowest Save [14:30:43] |
869 ft |
| Takeoff Height [11:02:57] |
705 ft |
| Landing Height [15:45:59] |
174 ft |
| Total Ascent | 34255 ft |
| Height Gain | |
| Above Takeoff | 3127 ft |
| Units | |
| Climb - GPS data | |
| Maximum Climb [14:08:33] |
4.4 m/s |
| Minimum Climb [14:21:53] |
-6.6 m/s |
| Units | |
| Speed | |
| Maximum Speed [14:57:09] |
74.0 km/h |
| Average Speed around course |
30.8 km/h |
| Average Speed over track length |
40.6 km/h |
| Units | |
| Tracklog | |
| Flight Duration | 4hrs 43mins |
| Track Points | 3023 |
| Recording Interval | 6 secs |
| Statistics Interval | 6 secs |
| Track Length | 191.6 km |
| Invalid Positions [< 1%] |
1 |
| Units | |
| Flight instrument - reported as | |
| GPSMap76CS Software Version 3.80 |
| Height: | |
| Speed: | |
| Climb: | |
| Distance: |
| Main Map: |
| First Tab: |