


| Duration | 0:00 | Takeoff Distance | 0 |
| Height: | metres |
| Climb: | m/sec |
| Speed: | km/h |
| Distance: | km |
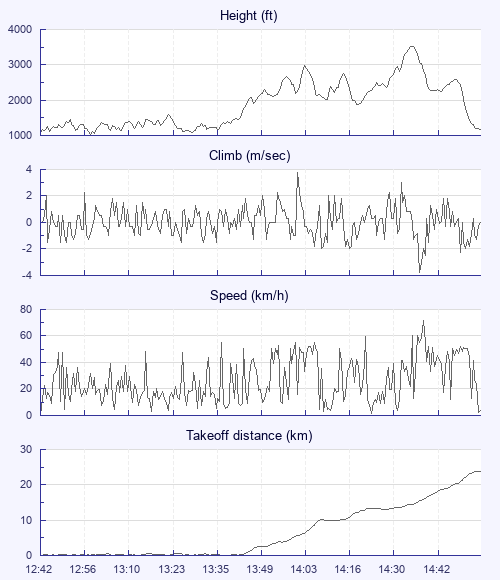
| Height - GPS data | |
| Maximum Height [14:40:10] |
3533 ft |
| Lowest Save [13:29:54] |
1093 ft |
| Takeoff Height [12:42:17] |
1093 ft |
| Landing Height [14:59:41] |
1158 ft |
| Total Ascent | 10919 ft |
| Height Gain | |
| Above Takeoff | 2441 ft |
| Maximum | 2497 ft |
| Low Point [12:59:00] |
1037 ft |
| High Point as Maximum Height |
3533 ft |
| Units | |
| Climb - Pressure data | |
| Maximum Climb [14:03:59] |
3.8 m/s |
| Minimum Climb [14:42:12] |
-3.8 m/s |
| Units | |
| Speed | |
| Maximum Speed [14:42:40] |
72.0 km/h |
| Average Speed around course |
13.8 km/h |
| Average Speed over track length |
25.8 km/h |
| Units | |
| Tracklog | |
| Flight Duration | 2hrs 17mins |
| Track Points | 4057 |
| Recording Interval | 2 secs |
| Statistics Interval | 4 secs |
| Track Length | 59.0 km |
| Units | |
| Flight instrument | |
| Type | Brauniger |
| Model | Competino+ |
| Firmware | 3.10e |
| Height: | |
| Speed: | |
| Climb: | |
| Distance: |
| Main Map: |
| First Tab: |