


| Duration | 0:00 | Takeoff Distance | 0 |
| Height: | metres |
| Climb: | m/sec |
| Speed: | km/h |
| Distance: | km |
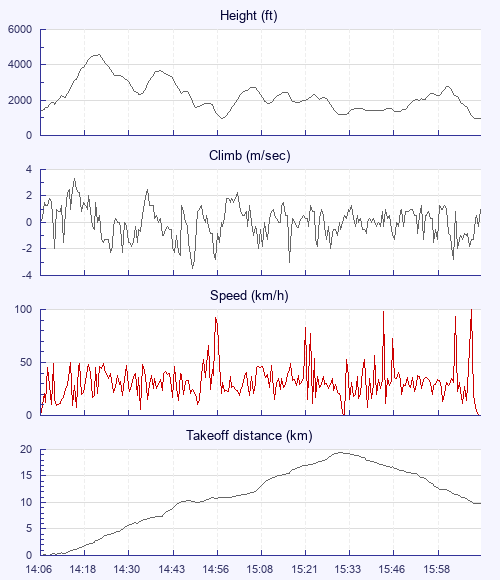
| Height - GPS data | |
| Maximum Height [14:22:27] |
4590 ft |
| Lowest Save [14:58:44] |
974 ft |
| Takeoff Height [14:06:26] |
1404 ft |
| Landing Height [16:14:09] |
965 ft |
| Total Ascent | 11552 ft |
| Height Gain | |
| Above Takeoff | 3186 ft |
| Units | |
| Climb - GPS data | |
| Maximum Climb [14:15:59] |
3.3 m/s |
| Minimum Climb [14:50:27] |
-3.5 m/s |
| Units | |
| Speed | |
| Maximum Speed [16:12:24] |
99.9 km/h |
| Average Speed around course |
15.5 km/h |
| Average Speed over track length |
32.4 km/h |
| Units | |
| Tracklog | |
| Flight Duration | 2hrs 7mins |
| Track Points | 1915 |
| Recording Interval | 4 secs |
| Statistics Interval | 4 secs |
| Track Length | 68.9 km |
| Invalid Positions [1.2%] |
23 |
| Units | |
| Flight instrument - reported as | |
| GPSMap60CX Software Version 4.00 |
| Height: | |
| Speed: | |
| Climb: | |
| Distance: |
| Main Map: |
| First Tab: |