


| Duration | 0:00 | Takeoff Distance | 0 |
| Height: | metres |
| Climb: | m/sec |
| Speed: | km/h |
| Distance: | km |
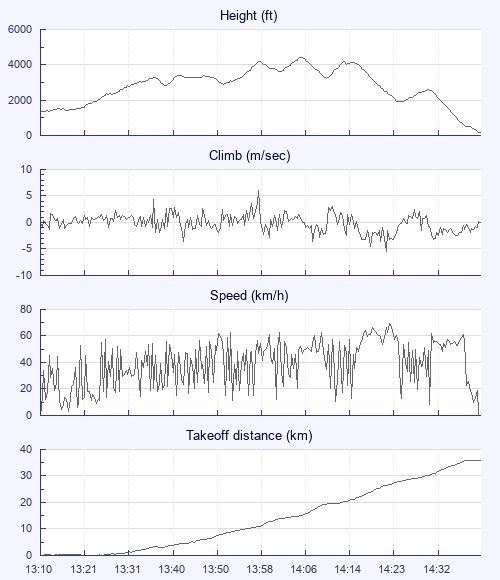
| Height - GPS data | |
| Maximum Height [14:06:24] |
4409 ft |
| Lowest Save [14:24:55] |
1900 ft |
| Takeoff Height [13:10:51] |
1319 ft |
| Landing Height [14:39:54] |
180 ft |
| Total Ascent | 8986 ft |
| Height Gain | |
| Above Takeoff | 3091 ft |
| Maximum | 3100 ft |
| Low Point [13:11:03] |
1309 ft |
| High Point as Maximum Height |
4409 ft |
| Units | |
| Climb - GPS data | |
| Maximum Climb [13:58:05] |
6.0 m/s |
| Minimum Climb [14:22:37] |
-5.5 m/s |
| Units | |
| Speed | |
| Maximum Speed [14:23:04] |
69.3 km/h |
| Average Speed around course |
25.7 km/h |
| Average Speed over track length |
37.9 km/h |
| Units | |
| Tracklog | |
| Flight Duration | 1hr 29mins |
| Track Points | 1906 |
| Recording Interval | 3 secs |
| Statistics Interval | 6 secs |
| Track Length | 56.3 km |
| Units | |
| Flight instrument - reported as | |
| GPSMap60CSX Software Version 4.20 |
| Height: | |
| Speed: | |
| Climb: | |
| Distance: |
| Main Map: |
| First Tab: |