


| Duration | 0:00 | Takeoff Distance | 0 |
| Height: | metres |
| Climb: | m/sec |
| Speed: | km/h |
| Distance: | km |
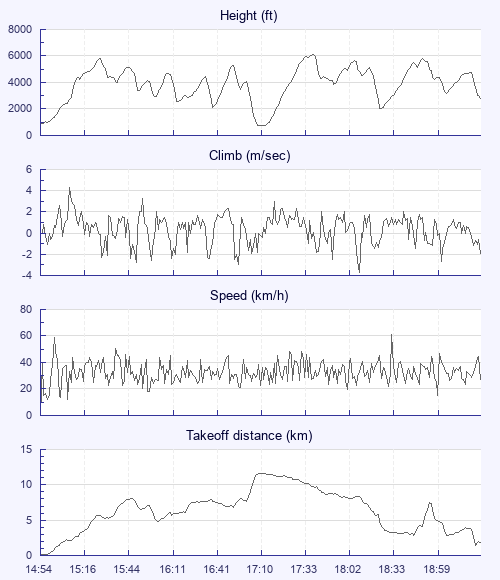
| Height - GPS data | |
| Maximum Height [17:43:01] |
6099 ft |
| Lowest Save [17:14:31] |
719 ft |
| Takeoff Height [14:54:21] |
837 ft |
| Landing Height [19:40:22] |
2825 ft |
| Total Ascent | 32142 ft |
| Height Gain | |
| Above Takeoff | 5262 ft |
| Maximum | 5381 ft |
| Low Point as Lowest Save |
719 ft |
| High Point as Maximum Height |
6099 ft |
| Units | |
| Climb - GPS data | |
| Maximum Climb [15:09:26] |
4.3 m/s |
| Minimum Climb [18:14:55] |
-3.7 m/s |
| Units | |
| Speed | |
| Maximum Speed [18:38:59] |
61.2 km/h |
| Average Speed around course |
9.9 km/h |
| Average Speed over track length |
32.5 km/h |
| Units | |
| Tracklog | |
| Flight Duration | 4hrs 46mins |
| Track Points | 3182 |
| Recording Interval | 5 secs |
| Statistics Interval | 5 secs |
| Track Length | 154.9 km |
| Units | |
| Flight instrument - reported as | |
| GPSMap76C Software Version 3.50 |
| Height: | |
| Speed: | |
| Climb: | |
| Distance: |
| Main Map: |
| First Tab: |