


| Duration | 0:00 | Takeoff Distance | 0 |
| Height: | metres |
| Climb: | m/sec |
| Speed: | km/h |
| Distance: | km |
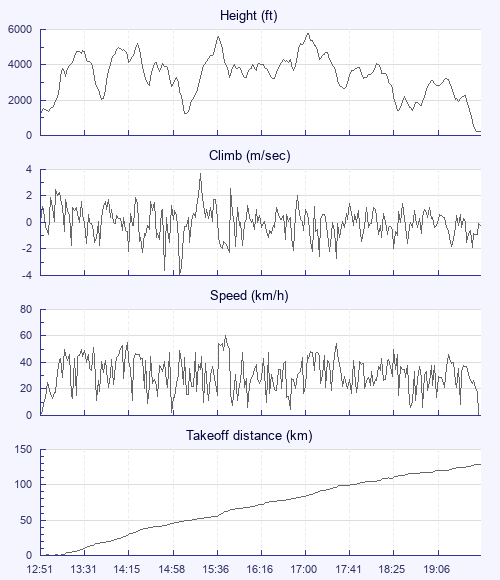
| Height - GPS data | |
| Maximum Height [17:01:51] |
5758 ft |
| Lowest Save [15:08:31] |
1250 ft |
| Takeoff Height [12:51:41] |
1237 ft |
| Landing Height [19:42:01] |
243 ft |
| Total Ascent | 32746 ft |
| Height Gain | |
| Above Takeoff | 4521 ft |
| Units | |
| Climb - GPS data | |
| Maximum Climb [15:21:11] |
3.7 m/s |
| Minimum Climb [15:04:41] |
-3.9 m/s |
| Units | |
| Speed | |
| Maximum Speed [15:44:41] |
60.1 km/h |
| Average Speed around course |
20.5 km/h |
| Average Speed over track length |
31.1 km/h |
| Units | |
| Tracklog | |
| Flight Duration | 6hrs 50mins |
| Track Points | 2463 |
| Recording Interval | 10 secs |
| Statistics Interval | 10 secs |
| Track Length | 212.7 km |
| Units | |
| Flight instrument - reported as | |
| GPSMap76CSX Software Version 4.00 |
| Height: | |
| Speed: | |
| Climb: | |
| Distance: |
| Main Map: |
| First Tab: |