Xc Title
User:Guest
Cloudbase Paragliding advert
Robert Heywood  All flights
National League 2013
Flight type image
Turnpoint Flight on a Paraglider
Club
Derbyshire
Glider
Nova Mentor 2
Date
25th May 2013
Start
11:25
Finish
15:50
Duration
4hrs 25mins
Takeoff
lords seat
Landing
Wolverhampton
Coords
Takeoff
53.34845, -1.83550
Start
53.34638, -1.83740
TP1
53.35075, -1.81470
TP2
53.05243, -2.10238
TP3
52.67510, -2.12250
Finish
52.60813, -2.18162
Landing
52.60897, -2.18103
Distances and Score
Leg 1
1.59k
Leg 2
38.36k
Leg 3
42.01k
Leg 4
8.46k
Total
90.42k
Score
90.4
Open Distance
Total
86.3k
Filename
Use full pilot name
Download
Validated
Yes
Flight map
Notes

This map gives an overview of the flight, using the turnpoints to plot the track.

Use the for a detailed map and flight track.

Duration 0:00   Takeoff Distance 0
Controls
To animate the flight: click a point on the track, use the slider, or click the Play button.
slider
slider
Speed
Speed
Slower
Faster
Track color
No data
Highlights
Track data
Time: No data
Height:
Climb:
Speed:
Interval:
Units
Height: metres
Climb: m/sec
Speed: km/h
Distance: km
chart
Notes

Climb and Speed averaged over 6 second intervals.

These values may be lower than those shown by a flight instrument, which has access to continuous raw data.

Red values indicate suspect data, because the tracklog contains invalid points.

Metric units are used for all chart data, except for Height which is shown in feet.

Height   -   GPS data
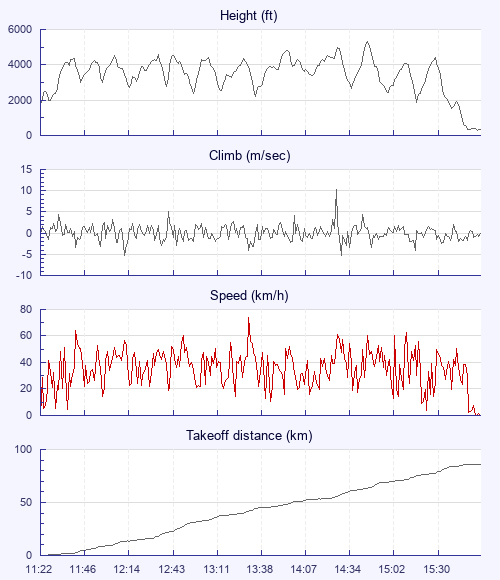
Maximum Height
[14:48:04]
5312 ft
Lowest Save
[15:41:21]
1549 ft
Takeoff Height
[11:22:33]
1729 ft
Landing Height
[15:55:26]
351 ft
Total Ascent 33934 ft
Height Gain
Above Takeoff 3583 ft
Units
Climb   -   GPS data
Maximum Climb
[14:28:48]
10.2 m/s
Minimum Climb
[12:12:50]
-5.3 m/s
Units
Speed
Maximum Speed
[13:31:51]
73.8 km/h
Average Speed
around course
20.5 km/h
Average Speed
over track length
33.2 km/h
Units
Tracklog
Flight Duration 4hrs 32mins
Track Points 5437
Recording Interval 3 secs
Statistics Interval 6 secs
Track Length 151.0 km
Invalid Positions
[< 1%]
1
Units
Flight instrument   -   reported as
DGIFLY
Notes

Climb and Speed averaged over 6 second intervals.

These values may be lower than those shown by a flight instrument, which has access to continuous raw data.

Red values indicate suspect data, because the tracklog contains invalid points.

Average Speed around course is measured from Start to Finish points.

Track Length is the cumulative distance between track points from Takeoff to Landing.

You can change the default units displayed - see the Options page.

Use this page to set various display Options. You can choose which units are used to display flight data, which map to show when the starts and which tab to show each time you view a flight.
Units settings

Metric units are used by default for the Statistics and XC Player pages, except for Height data which is shown in feet. You can choose your own custom settings here.

Height:
Speed:
Climb:
Distance:
  Use default
XC Player settings

When the XC Player starts, the track data is shown on the Hybrid map. You can choose a different map here.

Main Map:
  Use default
Tab settings

The first tab shown when you view a flight is the Flight Map. You can choose a different tab here.

First Tab:
  Use default
Notes

This page uses cookies to save your settings for future visits.

If you have disabled cookies for this site then any changes you make will not be saved.