


| Duration | 0:00 | Takeoff Distance | 0 |
| Height: | metres |
| Climb: | m/sec |
| Speed: | km/h |
| Distance: | km |
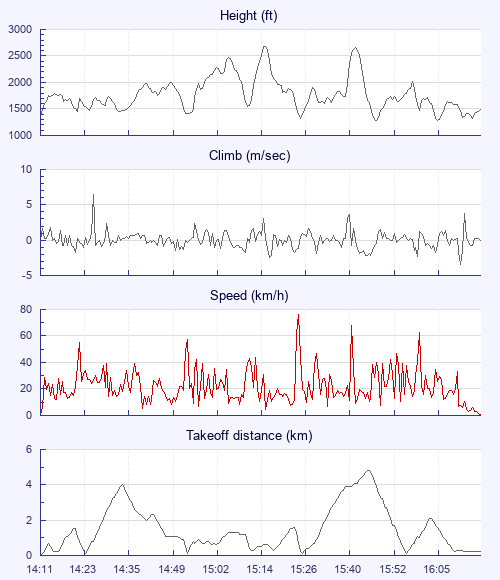
| Height - GPS data | |
| Maximum Height [15:16:49] |
2684 ft |
| Lowest Save [16:07:37] |
1283 ft |
| Takeoff Height [14:11:06] |
1348 ft |
| Landing Height [16:20:01] |
1483 ft |
| Total Ascent | 10285 ft |
| Height Gain | |
| Above Takeoff | 1335 ft |
| Maximum | 1365 ft |
| Low Point [15:27:23] |
1302 ft |
| High Point [15:44:14] |
2667 ft |
| Units | |
| Climb - GPS data | |
| Maximum Climb [14:26:16] |
6.5 m/s |
| Minimum Climb [16:14:08] |
-3.4 m/s |
| Units | |
| Speed | |
| Maximum Speed [15:26:59] |
76.2 km/h |
| Average Speed around course |
13.4 km/h |
| Average Speed over track length |
20.6 km/h |
| Units | |
| Tracklog | |
| Flight Duration | 2hrs 8mins |
| Track Points | 2568 |
| Recording Interval | 3 secs |
| Statistics Interval | 6 secs |
| Track Length | 44.2 km |
| Invalid Positions [< 1%] |
1 |
| Units | |
| Flight instrument - reported as | |
| DGIFLY |
| Height: | |
| Speed: | |
| Climb: | |
| Distance: |
| Main Map: |
| First Tab: |