


| Duration | 0:00 | Takeoff Distance | 0 |
| Height: | metres |
| Climb: | m/sec |
| Speed: | km/h |
| Distance: | km |
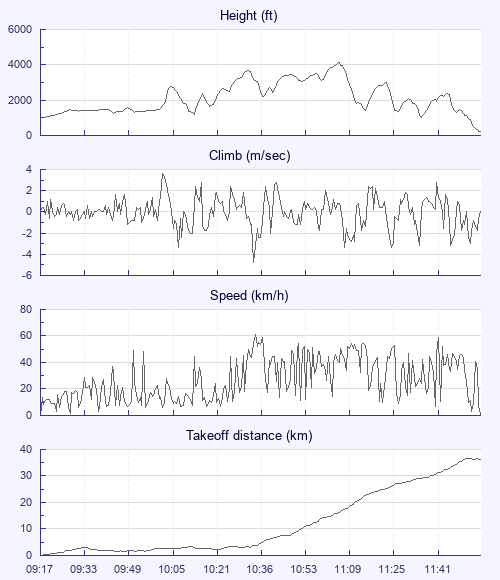
| Height - GPS data | |
| Maximum Height [11:06:44] |
4124 ft |
| Lowest Save [11:37:29] |
1047 ft |
| Takeoff Height [09:17:14] |
1024 ft |
| Landing Height [11:58:09] |
220 ft |
| Total Ascent | 14705 ft |
| Height Gain | |
| Above Takeoff | 3100 ft |
| Maximum | 3130 ft |
| Low Point [09:17:29] |
994 ft |
| High Point as Maximum Height |
4124 ft |
| Units | |
| Climb - Pressure data | |
| Maximum Climb [10:03:04] |
3.6 m/s |
| Minimum Climb [10:35:39] |
-4.8 m/s |
| Units | |
| Speed | |
| Maximum Speed [10:35:44] |
61.2 km/h |
| Average Speed around course |
17.3 km/h |
| Average Speed over track length |
27.2 km/h |
| Units | |
| Tracklog | |
| Flight Duration | 2hrs 40mins |
| Track Points | 1932 |
| Recording Interval | 5 secs |
| Statistics Interval | 5 secs |
| Track Length | 73.0 km |
| Units | |
| Flight instrument - reported as | |
| 6015 |
| Height: | |
| Speed: | |
| Climb: | |
| Distance: |
| Main Map: |
| First Tab: |