


| Duration | 0:00 | Takeoff Distance | 0 |
| Height: | metres |
| Climb: | m/sec |
| Speed: | km/h |
| Distance: | km |
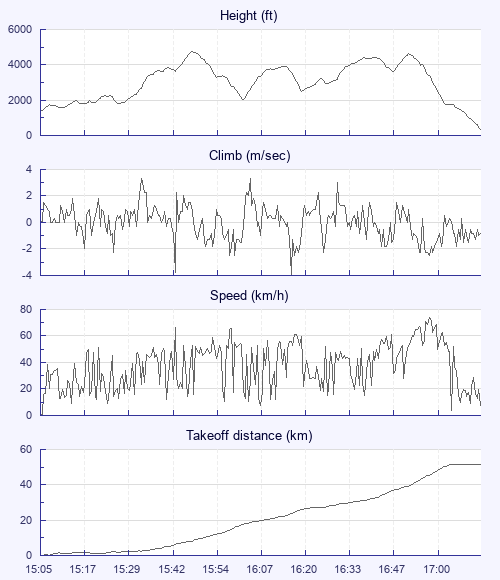
| Height - GPS data | |
| Maximum Height [15:49:18] |
4731 ft |
| Lowest Save [16:04:44] |
2034 ft |
| Takeoff Height [15:05:22] |
1391 ft |
| Landing Height [17:15:55] |
364 ft |
| Total Ascent | 12126 ft |
| Height Gain | |
| Above Takeoff | 3340 ft |
| Units | |
| Climb - Pressure data | |
| Maximum Climb [15:33:46] |
3.3 m/s |
| Minimum Climb [16:19:18] |
-4.0 m/s |
| Units | |
| Speed | |
| Maximum Speed [17:01:46] |
73.8 km/h |
| Average Speed around course |
26.4 km/h |
| Average Speed over track length |
37.9 km/h |
| Units | |
| Tracklog | |
| Flight Duration | 2hrs 10mins |
| Track Points | 7834 |
| Recording Interval | 1 secs |
| Statistics Interval | 4 secs |
| Track Length | 82.5 km |
| Units | |
| Flight instrument - reported as | |
| Flymaster F1, V1.21, S/N 1229 |
| Height: | |
| Speed: | |
| Climb: | |
| Distance: |
| Main Map: |
| First Tab: |