


| Duration | 0:00 | Takeoff Distance | 0 |
| Height: | metres |
| Climb: | m/sec |
| Speed: | km/h |
| Distance: | km |
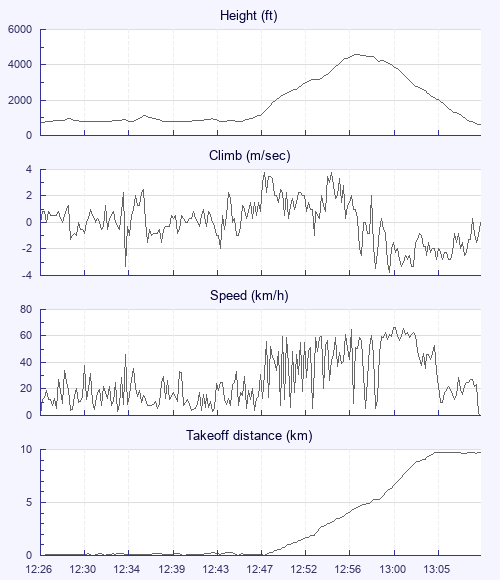
| Height - GPS data | |
| Maximum Height [12:57:52] |
4610 ft |
| Takeoff Height [12:26:07] |
719 ft |
| Landing Height [13:09:40] |
630 ft |
| Total Ascent | 5262 ft |
| Height Gain | |
| Above Takeoff | 3891 ft |
| Units | |
| Climb - GPS data | |
| Maximum Climb [12:48:32] |
3.8 m/s |
| Minimum Climb [13:00:48] |
-3.8 m/s |
| Units | |
| Speed | |
| Maximum Speed [13:01:08] |
66.6 km/h |
| Average Speed around course |
16.8 km/h |
| Average Speed over track length |
26.9 km/h |
| Units | |
| Tracklog | |
| Flight Duration | 43mins |
| Track Points | 654 |
| Recording Interval | 4 secs |
| Statistics Interval | 4 secs |
| Track Length | 19.5 km |
| Units | |
| Flight instrument - reported as | |
| GPSMap76CSX Software Version 4.00 - 292 |
| Height: | |
| Speed: | |
| Climb: | |
| Distance: |
| Main Map: |
| First Tab: |