


| Duration | 0:00 | Takeoff Distance | 0 |
| Height: | metres |
| Climb: | m/sec |
| Speed: | km/h |
| Distance: | km |
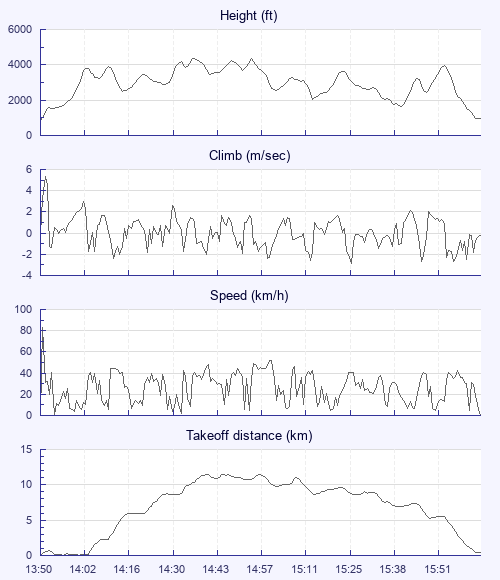
| Height - GPS data | |
| Maximum Height [14:38:37] |
4383 ft |
| Lowest Save [15:43:07] |
1667 ft |
| Takeoff Height [13:50:22] |
860 ft |
| Landing Height [16:07:57] |
961 ft |
| Total Ascent | 14367 ft |
| Height Gain | |
| Above Takeoff | 3524 ft |
| Units | |
| Climb - GPS data | |
| Maximum Climb [13:50:52] |
5.3 m/s |
| Minimum Climb [15:27:22] |
-2.9 m/s |
| Units | |
| Speed | |
| Maximum Speed [13:50:37] |
83.0 km/h |
| Average Speed around course |
14.7 km/h |
| Average Speed over track length |
25.7 km/h |
| Units | |
| Tracklog | |
| Flight Duration | 2hrs 17mins |
| Track Points | 552 |
| Recording Interval | 15 secs |
| Statistics Interval | 15 secs |
| Track Length | 59.0 km |
| Units | |
| Flight instrument - reported as | |
| GPSMAP 76S Software Version 3.21 |
| Height: | |
| Speed: | |
| Climb: | |
| Distance: |
| Main Map: |
| First Tab: |