Xc Title
User:Guest
UK Airsports advert
Charles Norwood  All flights
National League 2012
Flight type image
Tow-launch Turnpoint Flight on a Paraglider
Club
XClent
Glider
UP Trango XC2
Date
9th August 2012
Start
13:49
Finish
16:06
Duration
2hrs 17mins
Takeoff
XClent
Landing
Broadway
Coords
Takeoff
51.91183, -1.92333
Start
51.90247, -1.92283
TP1
51.93312, -1.91553
TP2
51.90772, -1.92108
TP3
52.08645, -1.92825
Finish
52.02853, -1.83570
Landing
52.02925, -1.85933
Distances and Score
Leg 1
3.45k
Leg 2
2.85k
Leg 3
19.89k
Leg 4
9.05k
Total
35.24k
Score
35.2
Open Distance
Total
20.5k
Filename
Use full pilot name
Download
Validated
Yes
Flight map
Notes

This map gives an overview of the flight, using the turnpoints to plot the track.

Use the for a detailed map and flight track.

Duration 0:00   Takeoff Distance 0
Controls
To animate the flight: click a point on the track, use the slider, or click the Play button.
slider
slider
Speed
Speed
Slower
Faster
Track color
No data
Highlights
Track data
Time: No data
Height:
Climb:
Speed:
Interval:
Units
Height: metres
Climb: m/sec
Speed: km/h
Distance: km
chart
Notes

Climb and Speed averaged over 4 second intervals.

These values may be lower than those shown by a flight instrument, which has access to continuous raw data.

Metric units are used for all chart data, except for Height which is shown in feet.

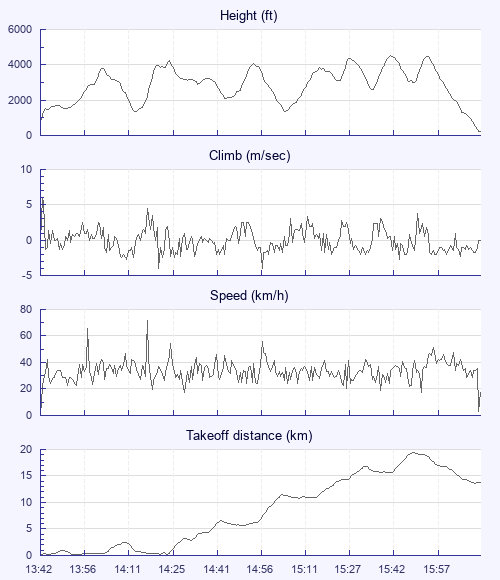
Height   -   Pressure data
Maximum Height
[15:42:23]
4514 ft
Lowest Save
[14:14:11]
1352 ft
Takeoff Height
[13:42:31]
804 ft
Landing Height
[16:11:27]
213 ft
Total Ascent 17936 ft
Height Gain
Above Takeoff 3711 ft
Units
Climb   -   Pressure data
Maximum Climb
[13:42:51]
6.0 m/s
Minimum Climb
[14:21:55]
-4.0 m/s
Units
Speed
Maximum Speed
[14:17:55]
72.0 km/h
Average Speed
around course
15.4 km/h
Average Speed
over track length
33.2 km/h
Units
Tracklog
Flight Duration 2hrs 28mins
Track Points 2235
Recording Interval 4 secs
Statistics Interval 4 secs
Track Length 82.5 km
Units
Flight instrument   -   reported as
XC Trainer V3.3-00
Notes

Climb and Speed averaged over 4 second intervals.

These values may be lower than those shown by a flight instrument, which has access to continuous raw data.

Average Speed around course is measured from Start to Finish points.

Track Length is the cumulative distance between track points from Takeoff to Landing.

You can change the default units displayed - see the Options page.

Use this page to set various display Options. You can choose which units are used to display flight data, which map to show when the starts and which tab to show each time you view a flight.
Units settings

Metric units are used by default for the Statistics and XC Player pages, except for Height data which is shown in feet. You can choose your own custom settings here.

Height:
Speed:
Climb:
Distance:
  Use default
XC Player settings

When the XC Player starts, the track data is shown on the Hybrid map. You can choose a different map here.

Main Map:
  Use default
Tab settings

The first tab shown when you view a flight is the Flight Map. You can choose a different tab here.

First Tab:
  Use default
Notes

This page uses cookies to save your settings for future visits.

If you have disabled cookies for this site then any changes you make will not be saved.