


| Duration | 0:00 | Takeoff Distance | 0 |
| Height: | metres |
| Climb: | m/sec |
| Speed: | km/h |
| Distance: | km |
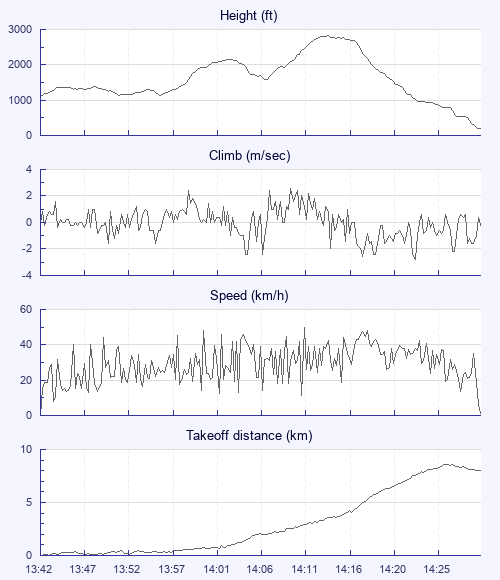
| Height - GPS data | |
| Maximum Height [14:14:08] |
2825 ft |
| Lowest Save [14:07:28] |
1588 ft |
| Takeoff Height [13:42:03] |
1112 ft |
| Landing Height [14:30:48] |
197 ft |
| Total Ascent | 3363 ft |
| Height Gain | |
| Above Takeoff | 1713 ft |
| Units | |
| Climb - GPS data | |
| Maximum Climb [14:10:13] |
2.6 m/s |
| Minimum Climb [14:23:38] |
-2.8 m/s |
| Units | |
| Speed | |
| Maximum Speed [14:11:33] |
49.7 km/h |
| Average Speed around course |
13.4 km/h |
| Average Speed over track length |
29.0 km/h |
| Units | |
| Tracklog | |
| Flight Duration | 48mins |
| Track Points | 586 |
| Recording Interval | 5 secs |
| Statistics Interval | 5 secs |
| Track Length | 23.6 km |
| Units | |
| Flight instrument - reported as | |
| GPSMap76CX Software Version 3.60 |
| Height: | |
| Speed: | |
| Climb: | |
| Distance: |
| Main Map: |
| First Tab: |