


| Duration | 0:00 | Takeoff Distance | 0 |
| Height: | metres |
| Climb: | m/sec |
| Speed: | km/h |
| Distance: | km |
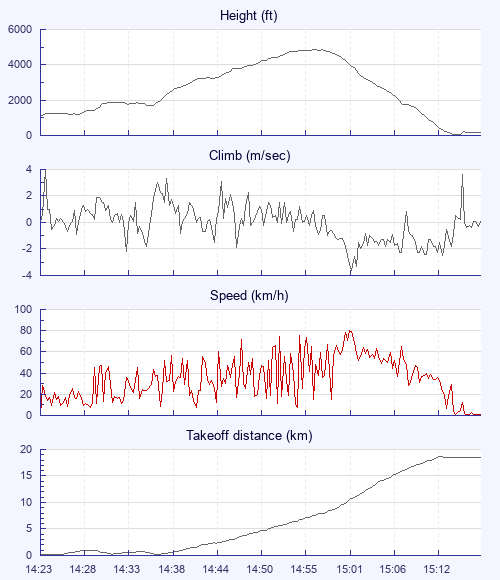
| Height - GPS data | |
| Maximum Height [14:59:13] |
4872 ft |
| Takeoff Height [14:23:17] |
1119 ft |
| Landing Height [15:18:51] |
157 ft |
| Total Ascent | 5440 ft |
| Height Gain | |
| Above Takeoff | 3753 ft |
| Maximum | 3757 ft |
| Low Point [14:23:22] |
1115 ft |
| High Point as Maximum Height |
4872 ft |
| Units | |
| Climb - GPS data | |
| Maximum Climb [14:23:47] |
4.0 m/s |
| Minimum Climb [15:02:46] |
-3.6 m/s |
| Units | |
| Speed | |
| Maximum Speed [15:02:34] |
80.1 km/h |
| Average Speed around course |
26.3 km/h |
| Average Speed over track length |
33.0 km/h |
| Units | |
| Tracklog | |
| Flight Duration | 55mins |
| Track Points | 1107 |
| Recording Interval | 3 secs |
| Statistics Interval | 6 secs |
| Track Length | 30.6 km |
| Invalid Positions [< 1%] |
3 |
| Units | |
| Flight instrument - reported as | |
| DGIFLY SW62.1 |
| Height: | |
| Speed: | |
| Climb: | |
| Distance: |
| Main Map: |
| First Tab: |