


| Duration | 0:00 | Takeoff Distance | 0 |
| Height: | metres |
| Climb: | m/sec |
| Speed: | km/h |
| Distance: | km |
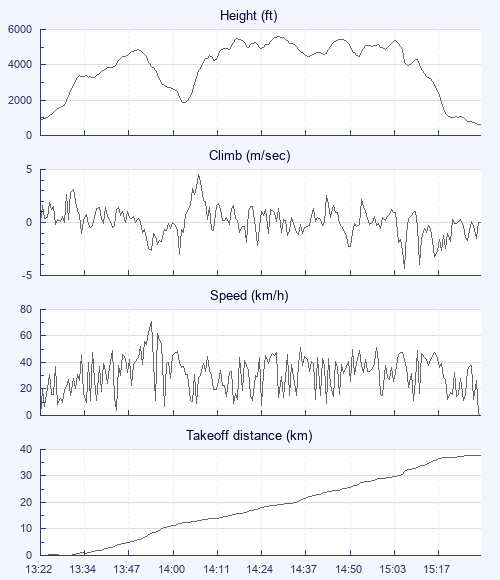
| Height - GPS data | |
| Maximum Height [14:31:10] |
5597 ft |
| Lowest Save [14:03:40] |
1864 ft |
| Takeoff Height [13:22:00] |
873 ft |
| Landing Height [15:30:43] |
620 ft |
| Total Ascent | 12818 ft |
| Height Gain | |
| Above Takeoff | 4724 ft |
| Units | |
| Climb - GPS data | |
| Maximum Climb [14:07:50] |
4.5 m/s |
| Minimum Climb [15:09:23] |
-4.3 m/s |
| Units | |
| Speed | |
| Maximum Speed [13:54:20] |
70.6 km/h |
| Average Speed around course |
19.9 km/h |
| Average Speed over track length |
31.4 km/h |
| Units | |
| Tracklog | |
| Flight Duration | 2hrs 8mins |
| Track Points | 769 |
| Recording Interval | 10 secs |
| Statistics Interval | 10 secs |
| Track Length | 67.3 km |
| Units | |
| Flight instrument - reported as | |
| GPSmap 96C Software Version 2.90 |
| Height: | |
| Speed: | |
| Climb: | |
| Distance: |
| Main Map: |
| First Tab: |