


| Duration | 0:00 | Takeoff Distance | 0 |
| Height: | metres |
| Climb: | m/sec |
| Speed: | km/h |
| Distance: | km |
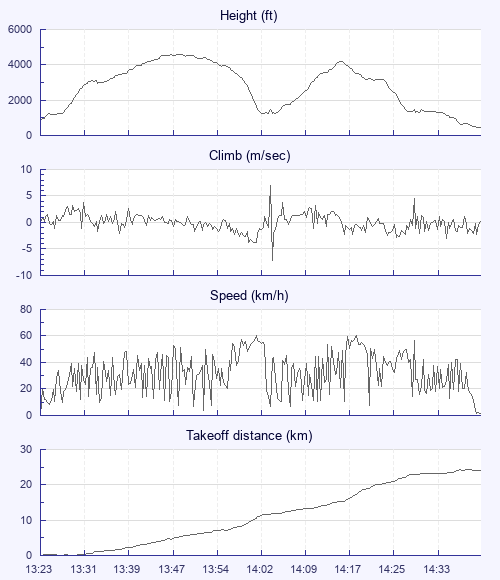
| Height - GPS data | |
| Maximum Height [13:48:44] |
4606 ft |
| Lowest Save [14:03:34] |
1224 ft |
| Takeoff Height [13:23:24] |
866 ft |
| Landing Height [14:42:54] |
466 ft |
| Total Ascent | 9360 ft |
| Height Gain | |
| Above Takeoff | 3740 ft |
| Units | |
| Climb - GPS data | |
| Maximum Climb [14:04:34] |
7.0 m/s |
| Minimum Climb [14:04:44] |
-7.2 m/s |
| Units | |
| Speed | |
| Maximum Speed [14:20:24] |
60.5 km/h |
| Average Speed around course |
20.3 km/h |
| Average Speed over track length |
32.2 km/h |
| Units | |
| Tracklog | |
| Flight Duration | 1hr 19mins |
| Track Points | 478 |
| Recording Interval | 10 secs |
| Statistics Interval | 10 secs |
| Track Length | 42.7 km |
| Units | |
| Flight instrument - reported as | |
| SP24XC SW2.70 |
| Height: | |
| Speed: | |
| Climb: | |
| Distance: |
| Main Map: |
| First Tab: |