


| Duration | 0:00 | Takeoff Distance | 0 |
| Height: | metres |
| Climb: | m/sec |
| Speed: | km/h |
| Distance: | km |
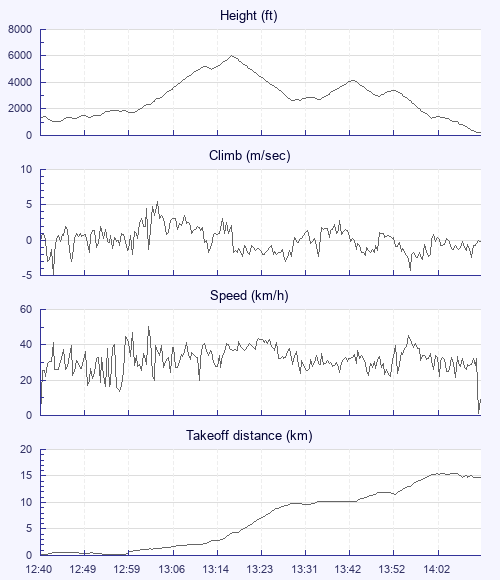
| Height - GPS data | |
| Maximum Height [13:18:16] |
6033 ft |
| Lowest Save [13:30:05] |
2631 ft |
| Takeoff Height [12:40:36] |
1352 ft |
| Landing Height [14:14:10] |
207 ft |
| Total Ascent | 9147 ft |
| Height Gain | |
| Above Takeoff | 4682 ft |
| Maximum | 5013 ft |
| Low Point [12:43:50] |
1020 ft |
| High Point as Maximum Height |
6033 ft |
| Units | |
| Climb - GPS data | |
| Maximum Climb [13:04:56] |
5.5 m/s |
| Minimum Climb [12:43:10] |
-5.0 m/s |
| Units | |
| Speed | |
| Maximum Speed [13:03:58] |
50.4 km/h |
| Average Speed around course |
12.0 km/h |
| Average Speed over track length |
30.3 km/h |
| Units | |
| Tracklog | |
| Flight Duration | 1hr 33mins |
| Track Points | 1878 |
| Recording Interval | 3 secs |
| Statistics Interval | 6 secs |
| Track Length | 47.3 km |
| Units | |
| Flight instrument - reported as | |
| GPSMAP 76S Software Version 4.00 |
| Height: | |
| Speed: | |
| Climb: | |
| Distance: |
| Main Map: |
| First Tab: |