


| Duration | 0:00 | Takeoff Distance | 0 |
| Height: | metres |
| Climb: | m/sec |
| Speed: | km/h |
| Distance: | km |
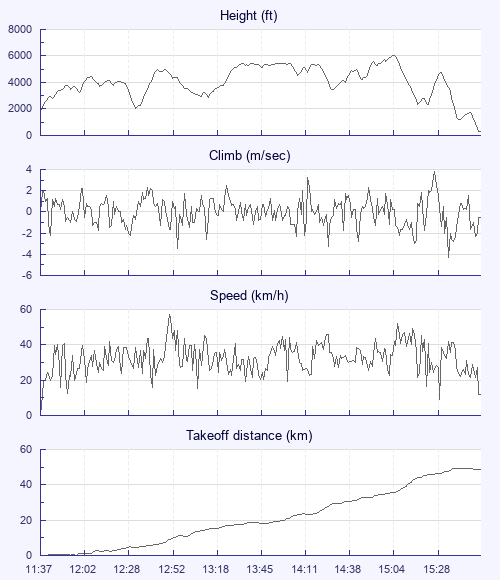
| Height - GPS data | |
| Maximum Height [15:04:41] |
6043 ft |
| Lowest Save [15:39:48] |
1171 ft |
| Takeoff Height [11:37:38] |
1890 ft |
| Landing Height [15:50:45] |
318 ft |
| Total Ascent | 20541 ft |
| Height Gain | |
| Above Takeoff | 4154 ft |
| Units | |
| Climb - Pressure data | |
| Maximum Climb [15:28:18] |
3.8 m/s |
| Minimum Climb [15:34:22] |
-4.3 m/s |
| Units | |
| Speed | |
| Maximum Speed [12:51:19] |
57.0 km/h |
| Average Speed around course |
14.3 km/h |
| Average Speed over track length |
32.9 km/h |
| Units | |
| Tracklog | |
| Flight Duration | 4hrs 13mins |
| Track Points | 4996 |
| Recording Interval | 3 secs |
| Statistics Interval | 6 secs |
| Track Length | 138.6 km |
| Units | |
| Flight instrument | |
| Type | Flytec |
| Model | 5020 |
| Firmware | 1.22 |
| Height: | |
| Speed: | |
| Climb: | |
| Distance: |
| Main Map: |
| First Tab: |