


| Duration | 0:00 | Takeoff Distance | 0 |
| Height: | metres |
| Climb: | m/sec |
| Speed: | km/h |
| Distance: | km |
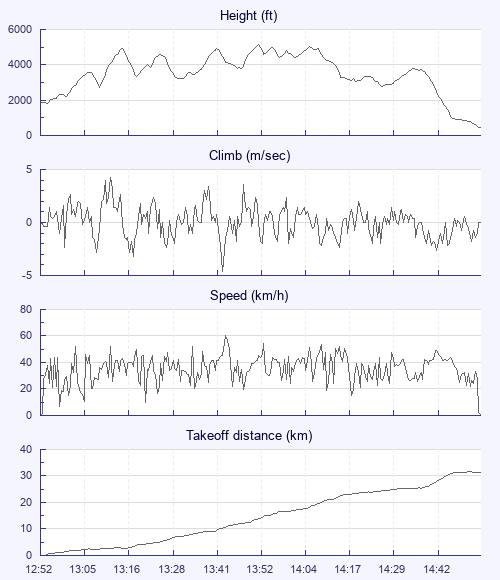
| Height - GPS data | |
| Maximum Height [13:52:28] |
5128 ft |
| Lowest Save [13:09:18] |
2717 ft |
| Takeoff Height [12:52:32] |
1886 ft |
| Landing Height [14:54:03] |
479 ft |
| Total Ascent | 12703 ft |
| Height Gain | |
| Above Takeoff | 3241 ft |
| Maximum | 3291 ft |
| Low Point [12:54:48] |
1837 ft |
| High Point as Maximum Height |
5128 ft |
| Units | |
| Climb - Pressure data | |
| Maximum Climb [13:12:08] |
4.2 m/s |
| Minimum Climb [13:43:08] |
-4.6 m/s |
| Units | |
| Speed | |
| Maximum Speed [13:43:38] |
60.5 km/h |
| Average Speed around course |
17.9 km/h |
| Average Speed over track length |
34.2 km/h |
| Units | |
| Tracklog | |
| Flight Duration | 2hrs 1min |
| Track Points | 1444 |
| Recording Interval | 5 secs |
| Statistics Interval | 5 secs |
| Track Length | 69.3 km |
| Units | |
| Flight instrument - reported as | |
| IQ-BASIC |
| Height: | |
| Speed: | |
| Climb: | |
| Distance: |
| Main Map: |
| First Tab: |