


| Duration | 0:00 | Takeoff Distance | 0 |
| Height: | metres |
| Climb: | m/sec |
| Speed: | km/h |
| Distance: | km |
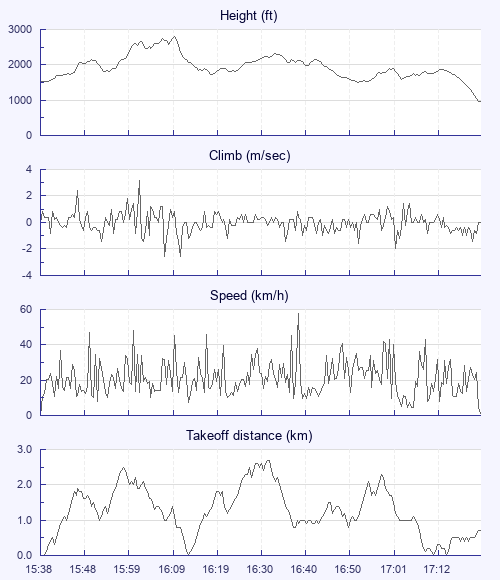
| Height - GPS data | |
| Maximum Height [16:10:12] |
2802 ft |
| Lowest Save [16:53:52] |
1503 ft |
| Takeoff Height [15:38:12] |
1506 ft |
| Landing Height [17:23:52] |
971 ft |
| Total Ascent | 5253 ft |
| Height Gain | |
| Above Takeoff | 1296 ft |
| Units | |
| Climb - GPS data | |
| Maximum Climb [16:01:52] |
3.2 m/s |
| Minimum Climb [16:08:07] |
-2.6 m/s |
| Units | |
| Speed | |
| Maximum Speed [16:40:22] |
57.6 km/h |
| Average Speed around course |
6.6 km/h |
| Average Speed over track length |
21.9 km/h |
| Units | |
| Tracklog | |
| Flight Duration | 1hr 45mins |
| Track Points | 1269 |
| Recording Interval | 5 secs |
| Statistics Interval | 5 secs |
| Track Length | 38.5 km |
| Units | |
| Flight instrument - reported as | |
| GPSMap76CSX Software Version 4.20 |
| Height: | |
| Speed: | |
| Climb: | |
| Distance: |
| Main Map: |
| First Tab: |