


| Duration | 0:00 | Takeoff Distance | 0 |
| Height: | metres |
| Climb: | m/sec |
| Speed: | km/h |
| Distance: | km |
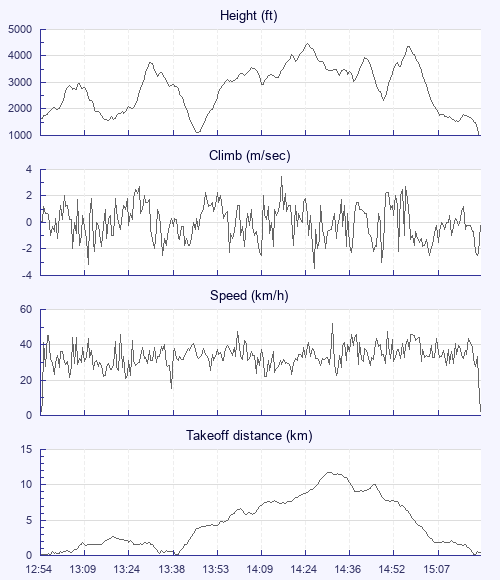
| Height - GPS data | |
| Maximum Height [14:24:49] |
4455 ft |
| Lowest Save [13:47:19] |
1102 ft |
| Takeoff Height [12:54:07] |
1647 ft |
| Landing Height [15:21:34] |
1017 ft |
| Total Ascent | 15551 ft |
| Height Gain | |
| Above Takeoff | 2808 ft |
| Maximum | 3353 ft |
| Low Point as Lowest Save |
1102 ft |
| High Point as Maximum Height |
4455 ft |
| Units | |
| Climb - Pressure data | |
| Maximum Climb [14:16:07] |
3.5 m/s |
| Minimum Climb [14:26:31] |
-3.5 m/s |
| Units | |
| Speed | |
| Maximum Speed [14:31:13] |
52.2 km/h |
| Average Speed around course |
12.1 km/h |
| Average Speed over track length |
34.1 km/h |
| Units | |
| Tracklog | |
| Flight Duration | 2hrs 27mins |
| Track Points | 2944 |
| Recording Interval | 3 secs |
| Statistics Interval | 6 secs |
| Track Length | 83.8 km |
| Units | |
| Flight instrument - reported as | |
| IQ-BASIC |
| Height: | |
| Speed: | |
| Climb: | |
| Distance: |
| Main Map: |
| First Tab: |