


| Duration | 0:00 | Takeoff Distance | 0 |
| Height: | metres |
| Climb: | m/sec |
| Speed: | km/h |
| Distance: | km |
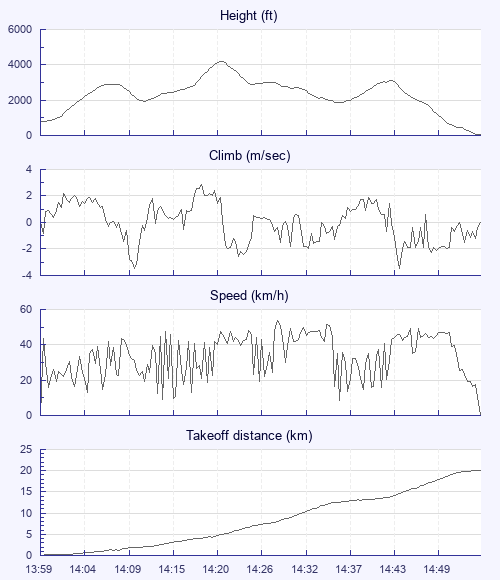
| Height - GPS data | |
| Maximum Height [14:21:10] |
4190 ft |
| Lowest Save [14:36:30] |
1844 ft |
| Takeoff Height [13:59:10] |
801 ft |
| Landing Height [14:53:50] |
66 ft |
| Total Ascent | 6073 ft |
| Height Gain | |
| Above Takeoff | 3389 ft |
| Maximum | 3415 ft |
| Low Point [13:59:20] |
774 ft |
| High Point as Maximum Height |
4190 ft |
| Units | |
| Climb - GPS data | |
| Maximum Climb [14:18:50] |
2.9 m/s |
| Minimum Climb [14:10:20] |
-3.5 m/s |
| Units | |
| Speed | |
| Maximum Speed [14:28:30] |
53.6 km/h |
| Average Speed around course |
24.6 km/h |
| Average Speed over track length |
33.7 km/h |
| Units | |
| Tracklog | |
| Flight Duration | 54mins |
| Track Points | 329 |
| Recording Interval | 10 secs |
| Statistics Interval | 10 secs |
| Track Length | 30.7 km |
| Units | |
| Flight instrument - reported as | |
| GPSMAP 76S Software Version 3.70 |
| Height: | |
| Speed: | |
| Climb: | |
| Distance: |
| Main Map: |
| First Tab: |