


| Duration | 0:00 | Takeoff Distance | 0 |
| Height: | metres |
| Climb: | m/sec |
| Speed: | km/h |
| Distance: | km |
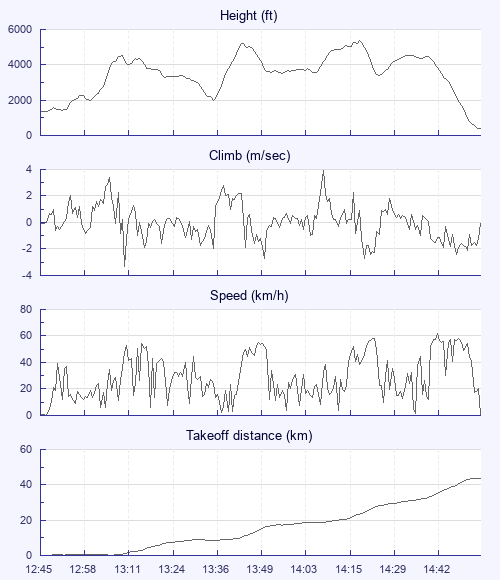
| Height - GPS data | |
| Maximum Height [14:21:15] |
5354 ft |
| Lowest Save [13:36:35] |
1978 ft |
| Takeoff Height [12:45:55] |
1358 ft |
| Landing Height [14:57:15] |
381 ft |
| Total Ascent | 11535 ft |
| Height Gain | |
| Above Takeoff | 3996 ft |
| Maximum | 4006 ft |
| Low Point [12:47:35] |
1348 ft |
| High Point as Maximum Height |
5354 ft |
| Units | |
| Climb - GPS data | |
| Maximum Climb [14:10:15] |
3.9 m/s |
| Minimum Climb [13:10:35] |
-3.3 m/s |
| Units | |
| Speed | |
| Maximum Speed [14:45:15] |
61.6 km/h |
| Average Speed around course |
22.6 km/h |
| Average Speed over track length |
28.7 km/h |
| Units | |
| Tracklog | |
| Flight Duration | 2hrs 11mins |
| Track Points | 395 |
| Recording Interval | 20 secs |
| Statistics Interval | 20 secs |
| Track Length | 62.8 km |
| Units | |
| Flight instrument - reported as | |
| eTrex Vista Software Version 3.60 |
| Height: | |
| Speed: | |
| Climb: | |
| Distance: |
| Main Map: |
| First Tab: |