


| Duration | 0:00 | Takeoff Distance | 0 |
| Height: | metres |
| Climb: | m/sec |
| Speed: | km/h |
| Distance: | km |
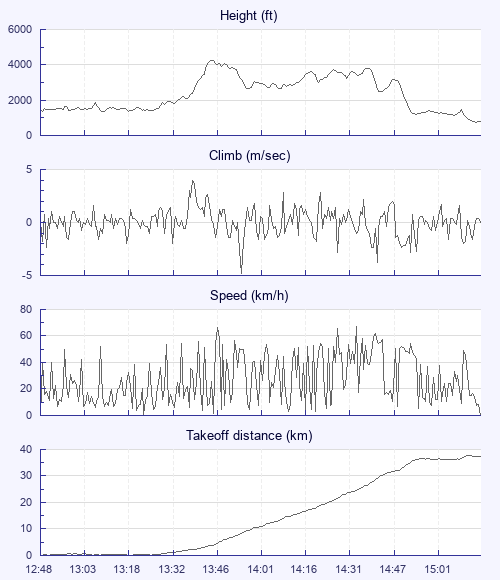
| Height - GPS data | |
| Maximum Height [13:46:19] |
4226 ft |
| Lowest Save [13:10:05] |
1345 ft |
| Takeoff Height [12:48:00] |
1483 ft |
| Landing Height [15:17:38] |
781 ft |
| Total Ascent | 12867 ft |
| Height Gain | |
| Above Takeoff | 2743 ft |
| Maximum | 2881 ft |
| Low Point as Lowest Save |
1345 ft |
| High Point as Maximum Height |
4226 ft |
| Units | |
| Climb - GPS data | |
| Maximum Climb [13:39:50] |
4.0 m/s |
| Minimum Climb [13:56:05] |
-4.8 m/s |
| Units | |
| Speed | |
| Maximum Speed [14:36:28] |
67.0 km/h |
| Average Speed around course |
17.7 km/h |
| Average Speed over track length |
27.8 km/h |
| Units | |
| Tracklog | |
| Flight Duration | 2hrs 29mins |
| Track Points | 1780 |
| Recording Interval | 5 secs |
| Statistics Interval | 5 secs |
| Track Length | 69.4 km |
| Units | |
| Flight instrument - reported as | |
| GPSMap76CSX Software Version 3.50 |
| Height: | |
| Speed: | |
| Climb: | |
| Distance: |
| Main Map: |
| First Tab: |