Xc Title
User:Guest
Ozone advert
Richard Westgate  All flights
National League 2010
Flight type image
Turnpoint Flight on a Paraglider
Club
Wessex
Glider
Gradient Aspen 3
Date
22nd April 2010
Start
11:43
Finish
16:06
Duration
4hrs 22mins
Takeoff
Bradwell
Landing
Skegness
Coords
Takeoff
53.32117, -1.73033
Start
53.32000, -1.73217
TP1
53.17483, -0.35467
TP2
53.19650, 0.10783
TP3
53.20400, 0.10733
Finish
53.16633, 0.35167
Landing
53.16617, 0.35100
Distances and Score
Leg 1
93.36k
Leg 2
31.01k
Leg 3
0.84k
Leg 4
16.86k
Total
142.07k
Score
142.1
Open Distance
Total
140.2k
Filename
Use full pilot name
Download
Validated
Yes
Flight map
Notes

This map gives an overview of the flight, using the turnpoints to plot the track.

Use the for a detailed map and flight track.

Duration 0:00   Takeoff Distance 0
Controls
To animate the flight: click a point on the track, use the slider, or click the Play button.
slider
slider
Speed
Speed
Slower
Faster
Track color
No data
Highlights
Track data
Time: No data
Height:
Climb:
Speed:
Interval:
Units
Height: metres
Climb: m/sec
Speed: km/h
Distance: km
chart
Notes

Climb and Speed averaged over 4 second intervals.

These values may be lower than those shown by a flight instrument, which has access to continuous raw data.

Red values indicate suspect data, because the tracklog contains invalid points.

Metric units are used for all chart data, except for Height which is shown in feet.

Height   -   Pressure data
Maximum Height
[15:10:37]
6467 ft
Lowest Save
[15:56:10]
807 ft
Takeoff Height
[11:42:27]
1234 ft
Landing Height
[16:09:33]
62 ft
Total Ascent 37552 ft
Height Gain
Above Takeoff 5233 ft
Units
Climb   -   Pressure data
Maximum Climb
[13:29:22]
5.5 m/s
Minimum Climb
[13:10:33]
-4.8 m/s
Units
Speed
Maximum Speed
[13:48:31]
81.0 km/h
Average Speed
around course
32.5 km/h
Average Speed
over track length
46.7 km/h
Units
Tracklog
Flight Duration 4hrs 27mins
Track Points 16027
Recording Interval 1 secs
Statistics Interval 4 secs
Track Length 207.9 km
Invalid Positions
[3.9%]
628
Units
Notes

Climb and Speed averaged over 4 second intervals.

These values may be lower than those shown by a flight instrument, which has access to continuous raw data.

Red values indicate suspect data, because the tracklog contains invalid points.

Average Speed around course is measured from Start to Finish points.

Track Length is the cumulative distance between track points from Takeoff to Landing.

You can change the default units displayed - see the Options page.

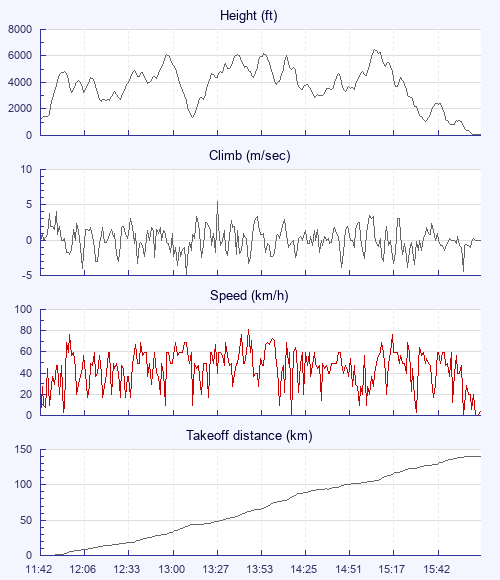
Took off early and climbed out almost straight away with David Broxholme and Andy Beevers. Stayed with Andy across the Peaks with a large area of weak lift over Froggatt, David did better by pushing south down the valley and climbing in the lee of the next spur. Scrabbled to get up in weak lift behind the Peaks with Andy; David pimping from above (his words! ) then running downwind. I pushed upwind to developng clouds and climbed to 4500ft then ran downwind to a much better cloud beyond Chestfield. Chasing peleton of David, Andy with Andy Wallis and Jean-Luc appeared 4000ft below. Decided not to wait as getting cold hands despite the hand warmers (thanks SimonG). Thought that battling below 4500ft in Worksop Corridor with a base this high wouldn't be much fun so went for a long glide to area of flat CU south of Clumber Park. Slow climb back to 6000ft then easy run for 30km with a well placed Cu right on the edge of Scampton allowing an effortless glide through the gap. 2.30 shut down saw me in survival mode for half an hour at 3500ft but still eating up the miles in 20kmh winds. Then finally Cu started to pop again on route and found climb to highest point of the day (6400ft). Low approach to Skegness, hitting the convergence 2km from the shore. Surprised by a strong S sea breeze blowing along the coast. Quick ice cream then train back to Sheffield with David who landed on the beach half and hour later. Thanks to Neil Furmidge for lift back to car from Sheffield train station! Back by 9.30. Grand day out.

Use this page to set various display Options. You can choose which units are used to display flight data, which map to show when the starts and which tab to show each time you view a flight.
Units settings

Metric units are used by default for the Statistics and XC Player pages, except for Height data which is shown in feet. You can choose your own custom settings here.

Height:
Speed:
Climb:
Distance:
  Use default
XC Player settings

When the XC Player starts, the track data is shown on the Hybrid map. You can choose a different map here.

Main Map:
  Use default
Tab settings

The first tab shown when you view a flight is the Flight Map. You can choose a different tab here.

First Tab:
  Use default
Notes

This page uses cookies to save your settings for future visits.

If you have disabled cookies for this site then any changes you make will not be saved.