


| Duration | 0:00 | Takeoff Distance | 0 |
| Height: | metres |
| Climb: | m/sec |
| Speed: | km/h |
| Distance: | km |
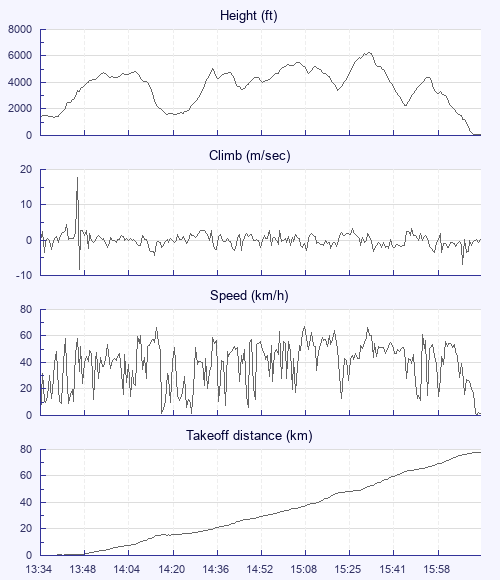
| Height - GPS data | |
| Maximum Height [15:32:58] |
6237 ft |
| Lowest Save [14:20:18] |
1549 ft |
| Takeoff Height [13:34:03] |
1388 ft |
| Landing Height [16:13:03] |
72 ft |
| Total Ascent | 20115 ft |
| Height Gain | |
| Above Takeoff | 4849 ft |
| Maximum | 4888 ft |
| Low Point [13:38:48] |
1348 ft |
| High Point as Maximum Height |
6237 ft |
| Units | |
| Climb - GPS data | |
| Maximum Climb [13:45:58] |
17.6 m/s |
| Minimum Climb [13:46:03] |
-8.4 m/s |
| Units | |
| Speed | |
| Maximum Speed [15:08:53] |
67.0 km/h |
| Average Speed around course |
30.7 km/h |
| Average Speed over track length |
39.2 km/h |
| Units | |
| Tracklog | |
| Flight Duration | 2hrs 39mins |
| Track Points | 1909 |
| Recording Interval | 5 secs |
| Statistics Interval | 5 secs |
| Track Length | 104.0 km |
| Units | |
| Flight instrument - reported as | |
| SP24XC SW2.70 |
| Height: | |
| Speed: | |
| Climb: | |
| Distance: |
| Main Map: |
| First Tab: |