


| Duration | 0:00 | Takeoff Distance | 0 |
| Height: | metres |
| Climb: | m/sec |
| Speed: | km/h |
| Distance: | km |
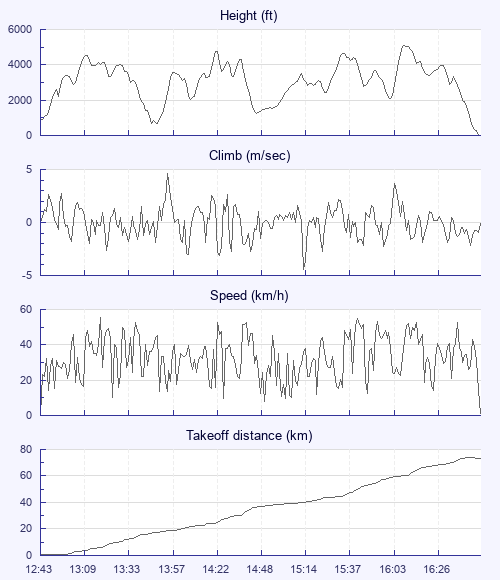
| Height - GPS data | |
| Maximum Height [16:15:09] |
5089 ft |
| Lowest Save [13:51:29] |
699 ft |
| Takeoff Height [12:43:39] |
873 ft |
| Landing Height [16:54:59] |
0 ft |
| Total Ascent | 26854 ft |
| Height Gain | |
| Above Takeoff | 4216 ft |
| Maximum | 4390 ft |
| Low Point as Lowest Save |
699 ft |
| High Point as Maximum Height |
5089 ft |
| Units | |
| Climb - GPS data | |
| Maximum Climb [13:56:59] |
4.6 m/s |
| Minimum Climb [15:17:29] |
-4.4 m/s |
| Units | |
| Speed | |
| Maximum Speed [13:19:09] |
55.4 km/h |
| Average Speed around course |
19.9 km/h |
| Average Speed over track length |
32.7 km/h |
| Units | |
| Tracklog | |
| Flight Duration | 4hrs 11mins |
| Track Points | 1509 |
| Recording Interval | 10 secs |
| Statistics Interval | 10 secs |
| Track Length | 137.1 km |
| Units | |
| Flight instrument - reported as | |
| XC Trainer V3.2-07, S/N 4129 |
| Height: | |
| Speed: | |
| Climb: | |
| Distance: |
| Main Map: |
| First Tab: |