


| Duration | 0:00 | Takeoff Distance | 0 |
| Height: | metres |
| Climb: | m/sec |
| Speed: | km/h |
| Distance: | km |
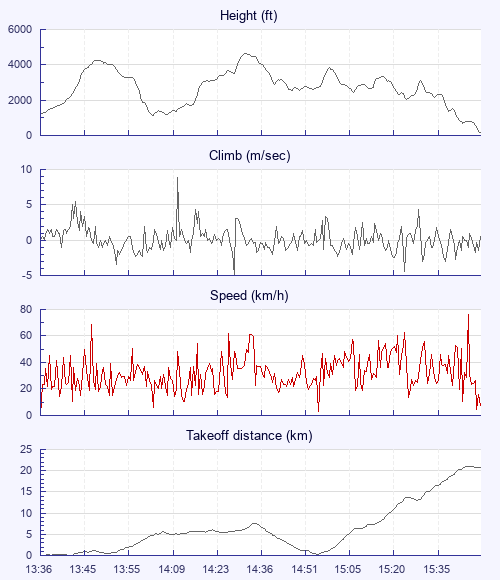
| Height - GPS data | |
| Maximum Height [14:32:31] |
4659 ft |
| Lowest Save [14:03:21] |
1155 ft |
| Takeoff Height [13:36:57] |
1257 ft |
| Landing Height [15:48:43] |
187 ft |
| Total Ascent | 15085 ft |
| Height Gain | |
| Above Takeoff | 3402 ft |
| Maximum | 3504 ft |
| Low Point as Lowest Save |
1155 ft |
| High Point as Maximum Height |
4659 ft |
| Units | |
| Climb - GPS data | |
| Maximum Climb [14:11:15] |
8.8 m/s |
| Minimum Climb [14:29:11] |
-5.0 m/s |
| Units | |
| Speed | |
| Maximum Speed [15:45:43] |
76.5 km/h |
| Average Speed around course |
16.9 km/h |
| Average Speed over track length |
33.1 km/h |
| Units | |
| Tracklog | |
| Flight Duration | 2hrs 11mins |
| Track Points | 4267 |
| Recording Interval | 2 secs |
| Statistics Interval | 4 secs |
| Track Length | 72.8 km |
| Invalid Positions [< 1%] |
4 |
| Units | |
| Flight instrument - reported as | |
| DGIFLY SW61.1 |
| Height: | |
| Speed: | |
| Climb: | |
| Distance: |
| Main Map: |
| First Tab: |