


| Duration | 0:00 | Takeoff Distance | 0 |
| Height: | metres |
| Climb: | m/sec |
| Speed: | km/h |
| Distance: | km |
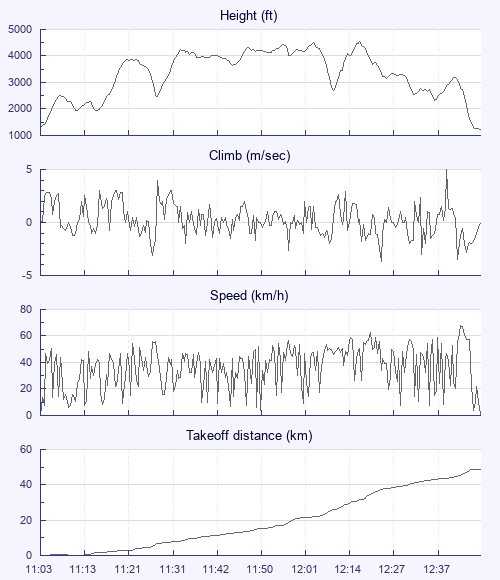
| Height - GPS data | |
| Maximum Height [12:20:43] |
4534 ft |
| Lowest Save [11:16:28] |
1939 ft |
| Takeoff Height [11:03:55] |
1309 ft |
| Landing Height [12:48:33] |
1234 ft |
| Total Ascent | 11637 ft |
| Height Gain | |
| Above Takeoff | 3225 ft |
| Units | |
| Climb - GPS data | |
| Maximum Climb [12:41:47] |
5.0 m/s |
| Minimum Climb [12:27:27] |
-3.7 m/s |
| Units | |
| Speed | |
| Maximum Speed [12:44:27] |
67.9 km/h |
| Average Speed around course |
29.3 km/h |
| Average Speed over track length |
38.1 km/h |
| Units | |
| Tracklog | |
| Flight Duration | 1hr 44mins |
| Track Points | 1193 |
| Recording Interval | 5 secs |
| Statistics Interval | 5 secs |
| Track Length | 66.4 km |
| Units | |
| Flight instrument - reported as | |
| eTrex Legend Software Version 3.70 |
| Height: | |
| Speed: | |
| Climb: | |
| Distance: |
| Main Map: |
| First Tab: |