


| Duration | 0:00 | Takeoff Distance | 0 |
| Height: | metres |
| Climb: | m/sec |
| Speed: | km/h |
| Distance: | km |
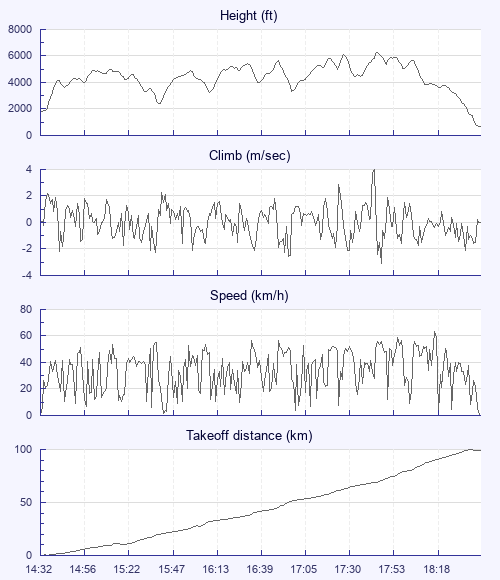
| Height - GPS data | |
| Maximum Height [17:47:08] |
6243 ft |
| Lowest Save [15:40:23] |
2392 ft |
| Takeoff Height [14:32:25] |
1834 ft |
| Landing Height [18:41:55] |
692 ft |
| Total Ascent | 19636 ft |
| Height Gain | |
| Above Takeoff | 4409 ft |
| Units | |
| Climb - Pressure data | |
| Maximum Climb [17:45:58] |
4.0 m/s |
| Minimum Climb [17:48:28] |
-3.1 m/s |
| Units | |
| Speed | |
| Maximum Speed [18:18:22] |
63.7 km/h |
| Average Speed around course |
25.2 km/h |
| Average Speed over track length |
34.4 km/h |
| Units | |
| Tracklog | |
| Flight Duration | 4hrs 9mins |
| Track Points | 1495 |
| Recording Interval | 10 secs |
| Statistics Interval | 10 secs |
| Track Length | 143.1 km |
| Units | |
| Flight instrument - reported as | |
| COMPETINO+, SN00500, SW3.05 |
| Height: | |
| Speed: | |
| Climb: | |
| Distance: |
| Main Map: |
| First Tab: |